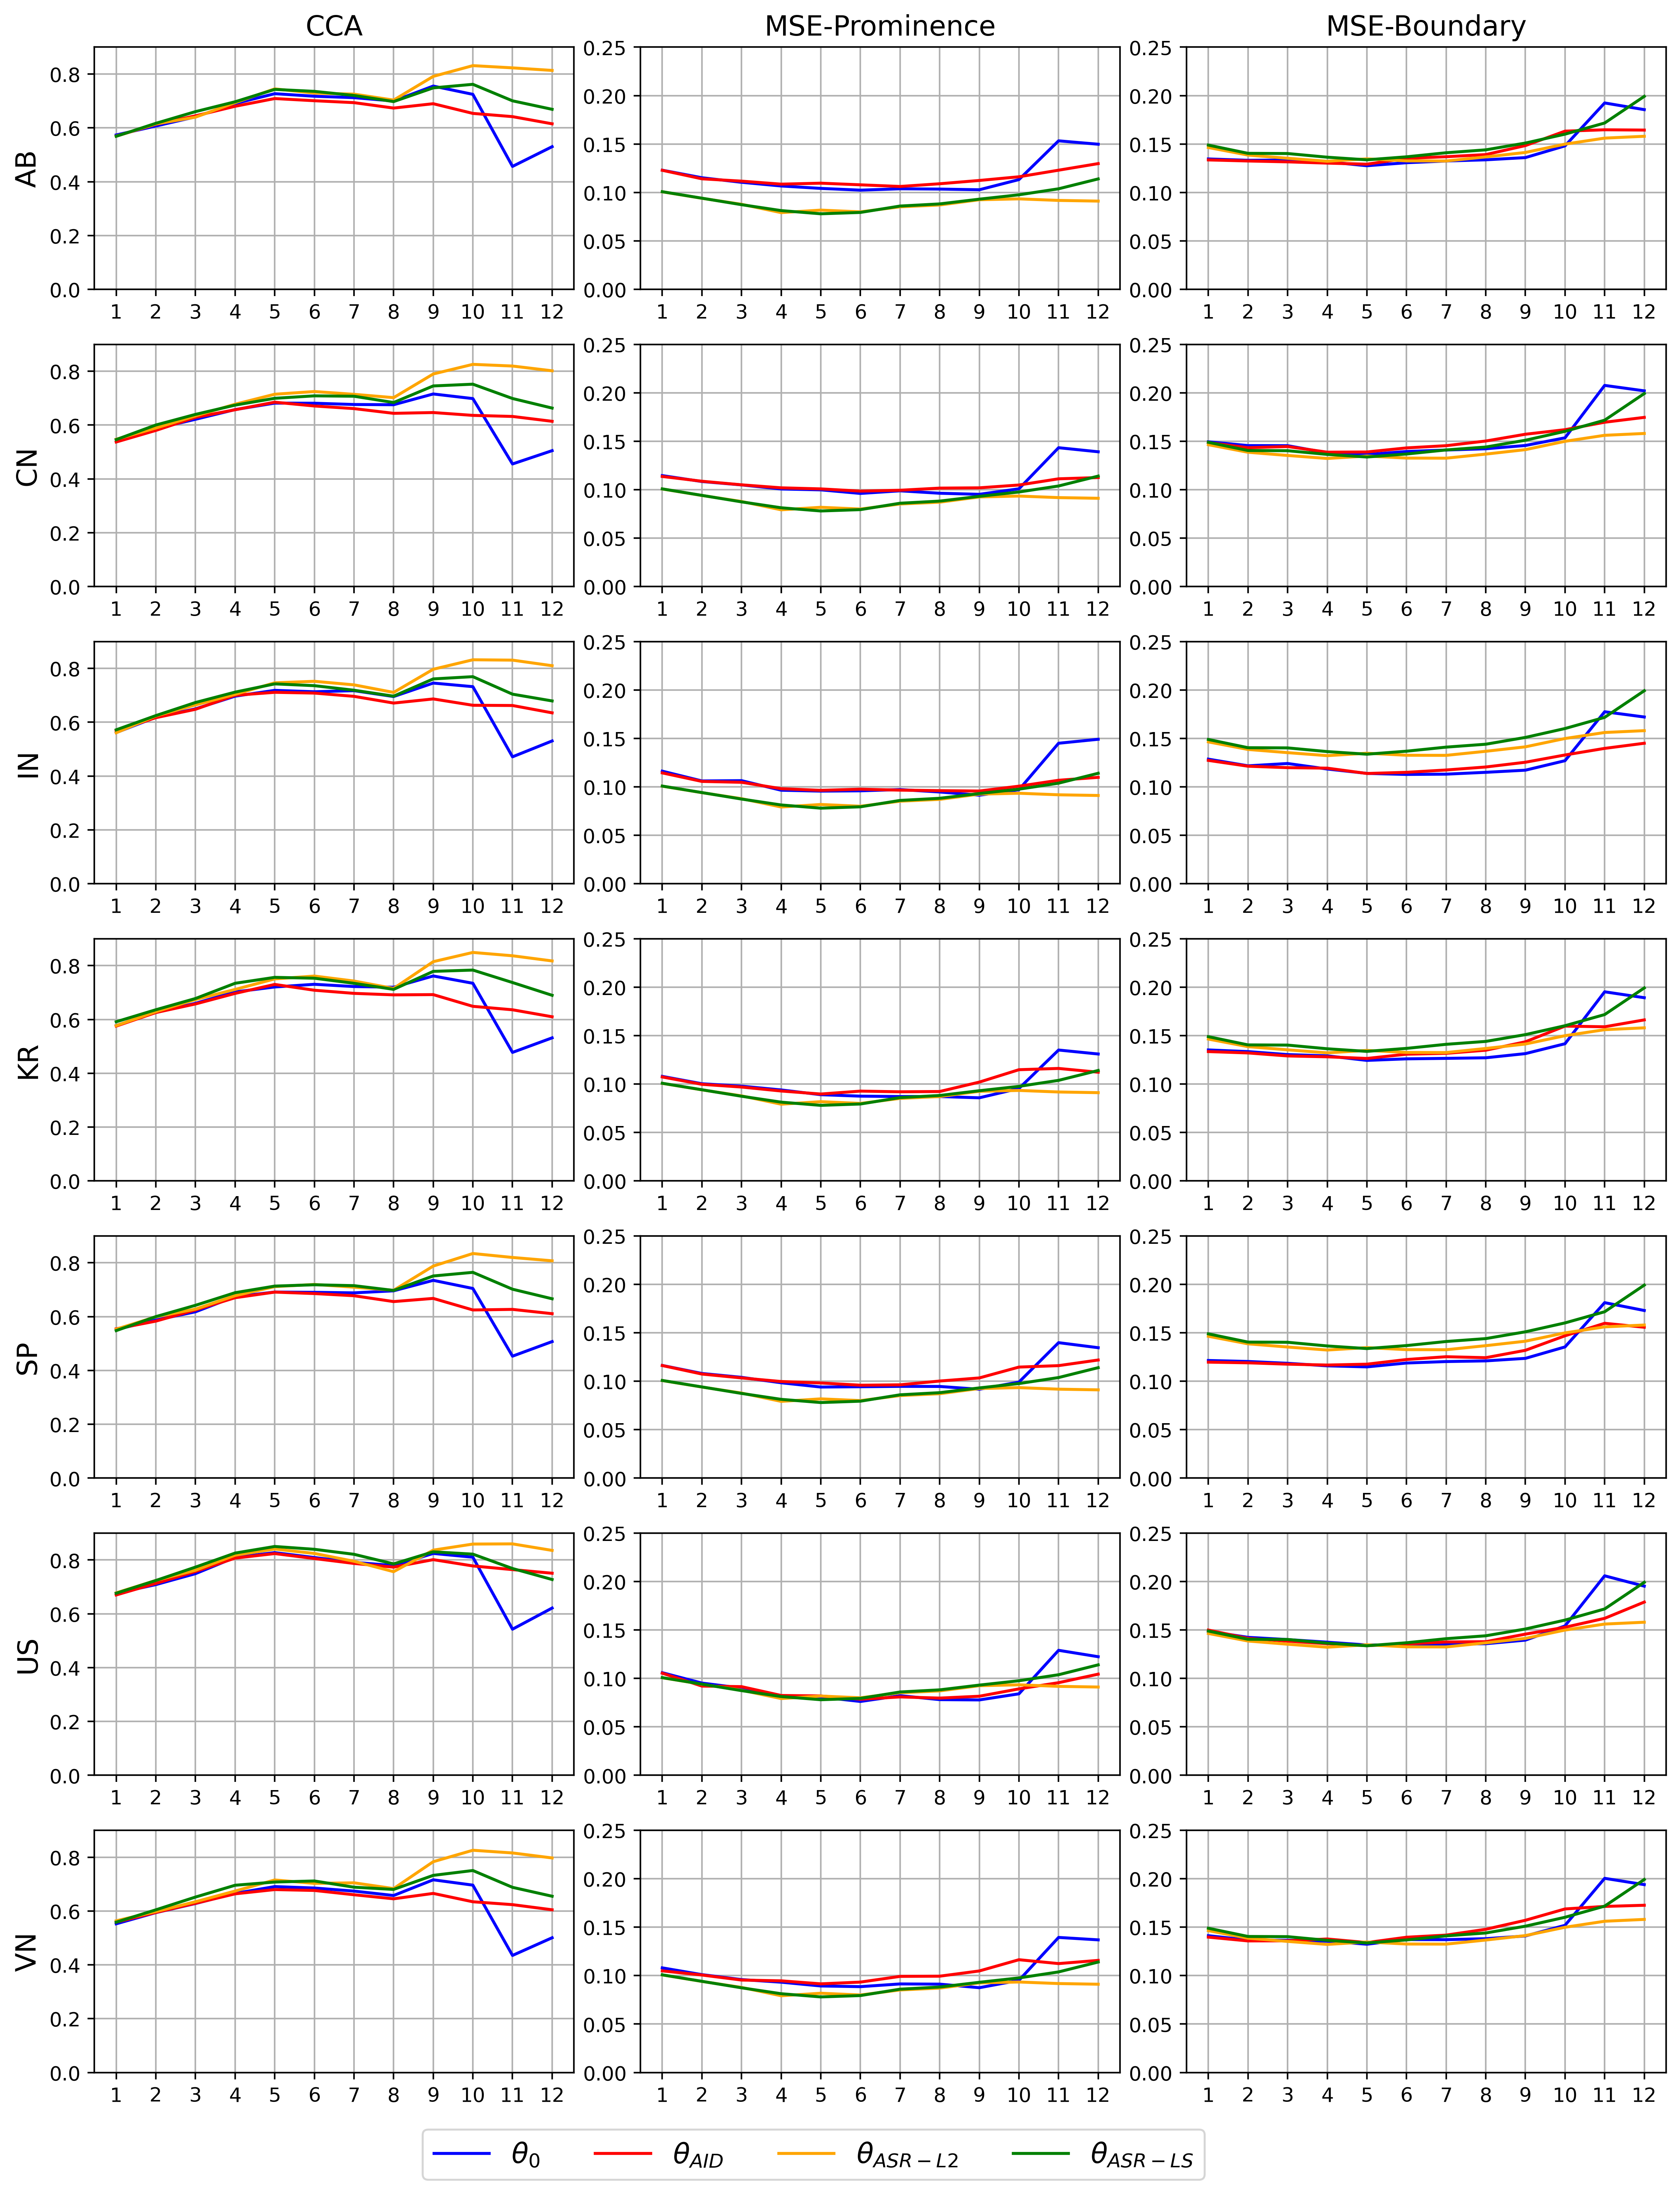
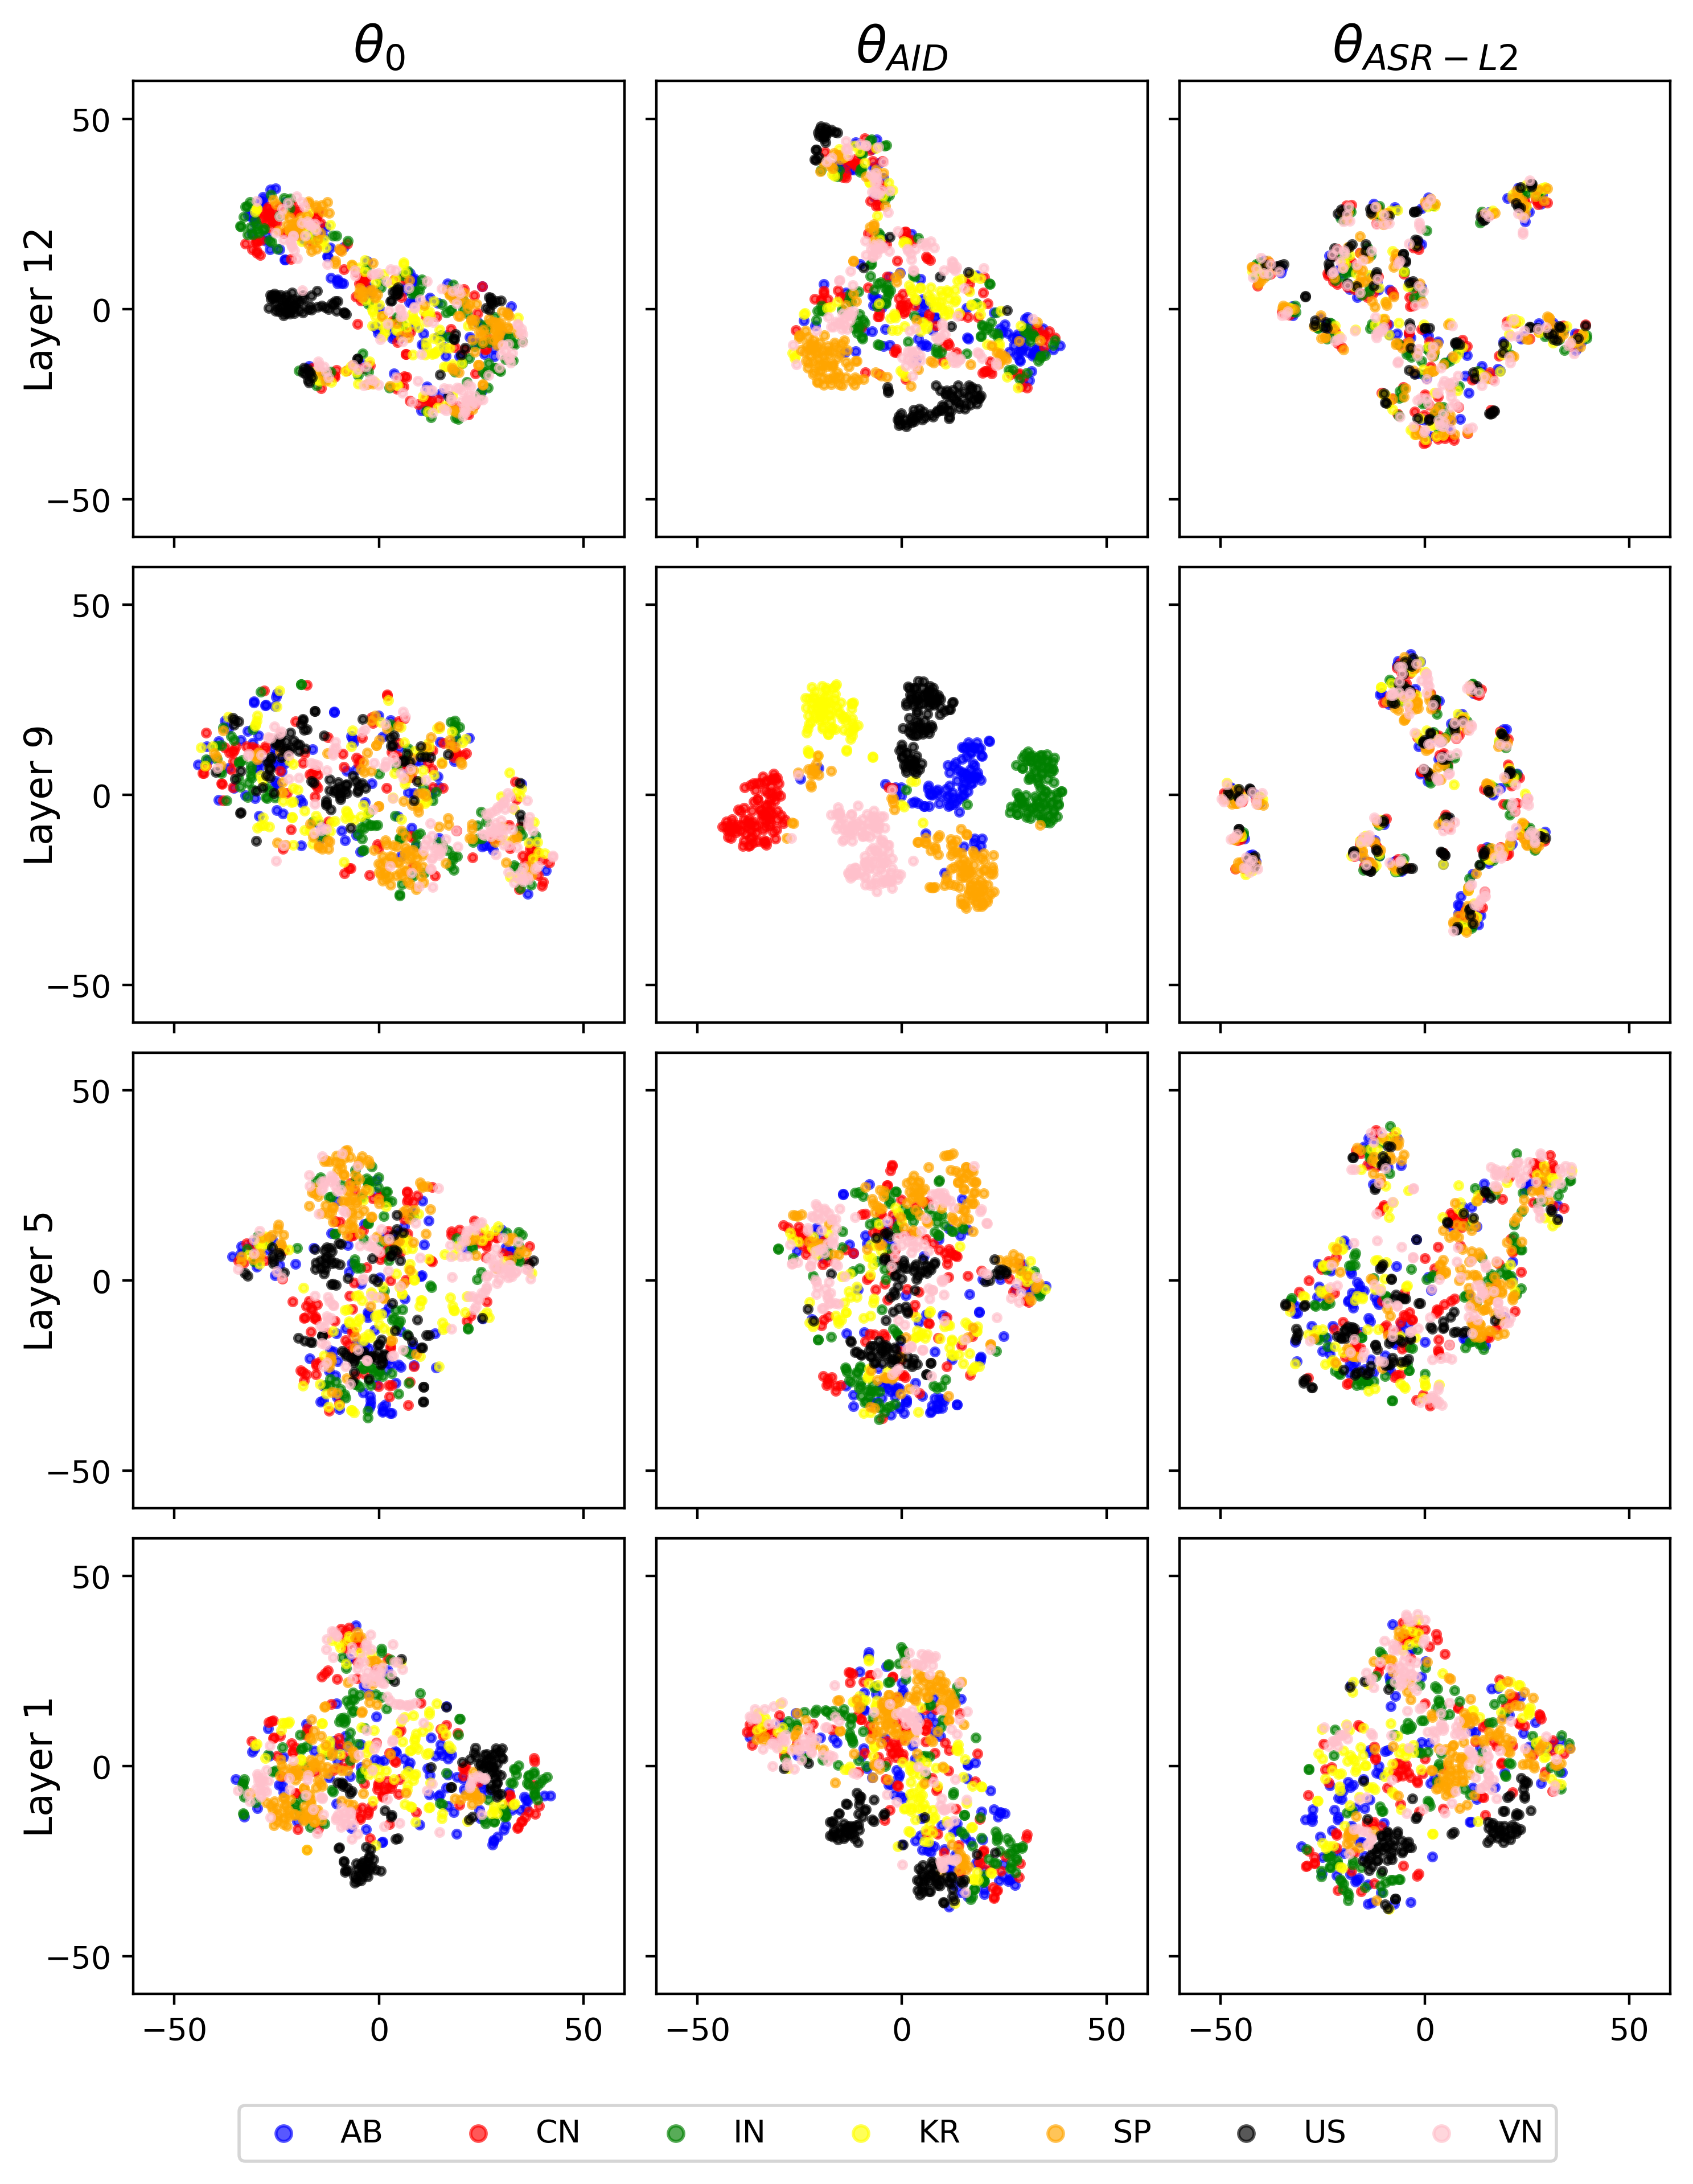
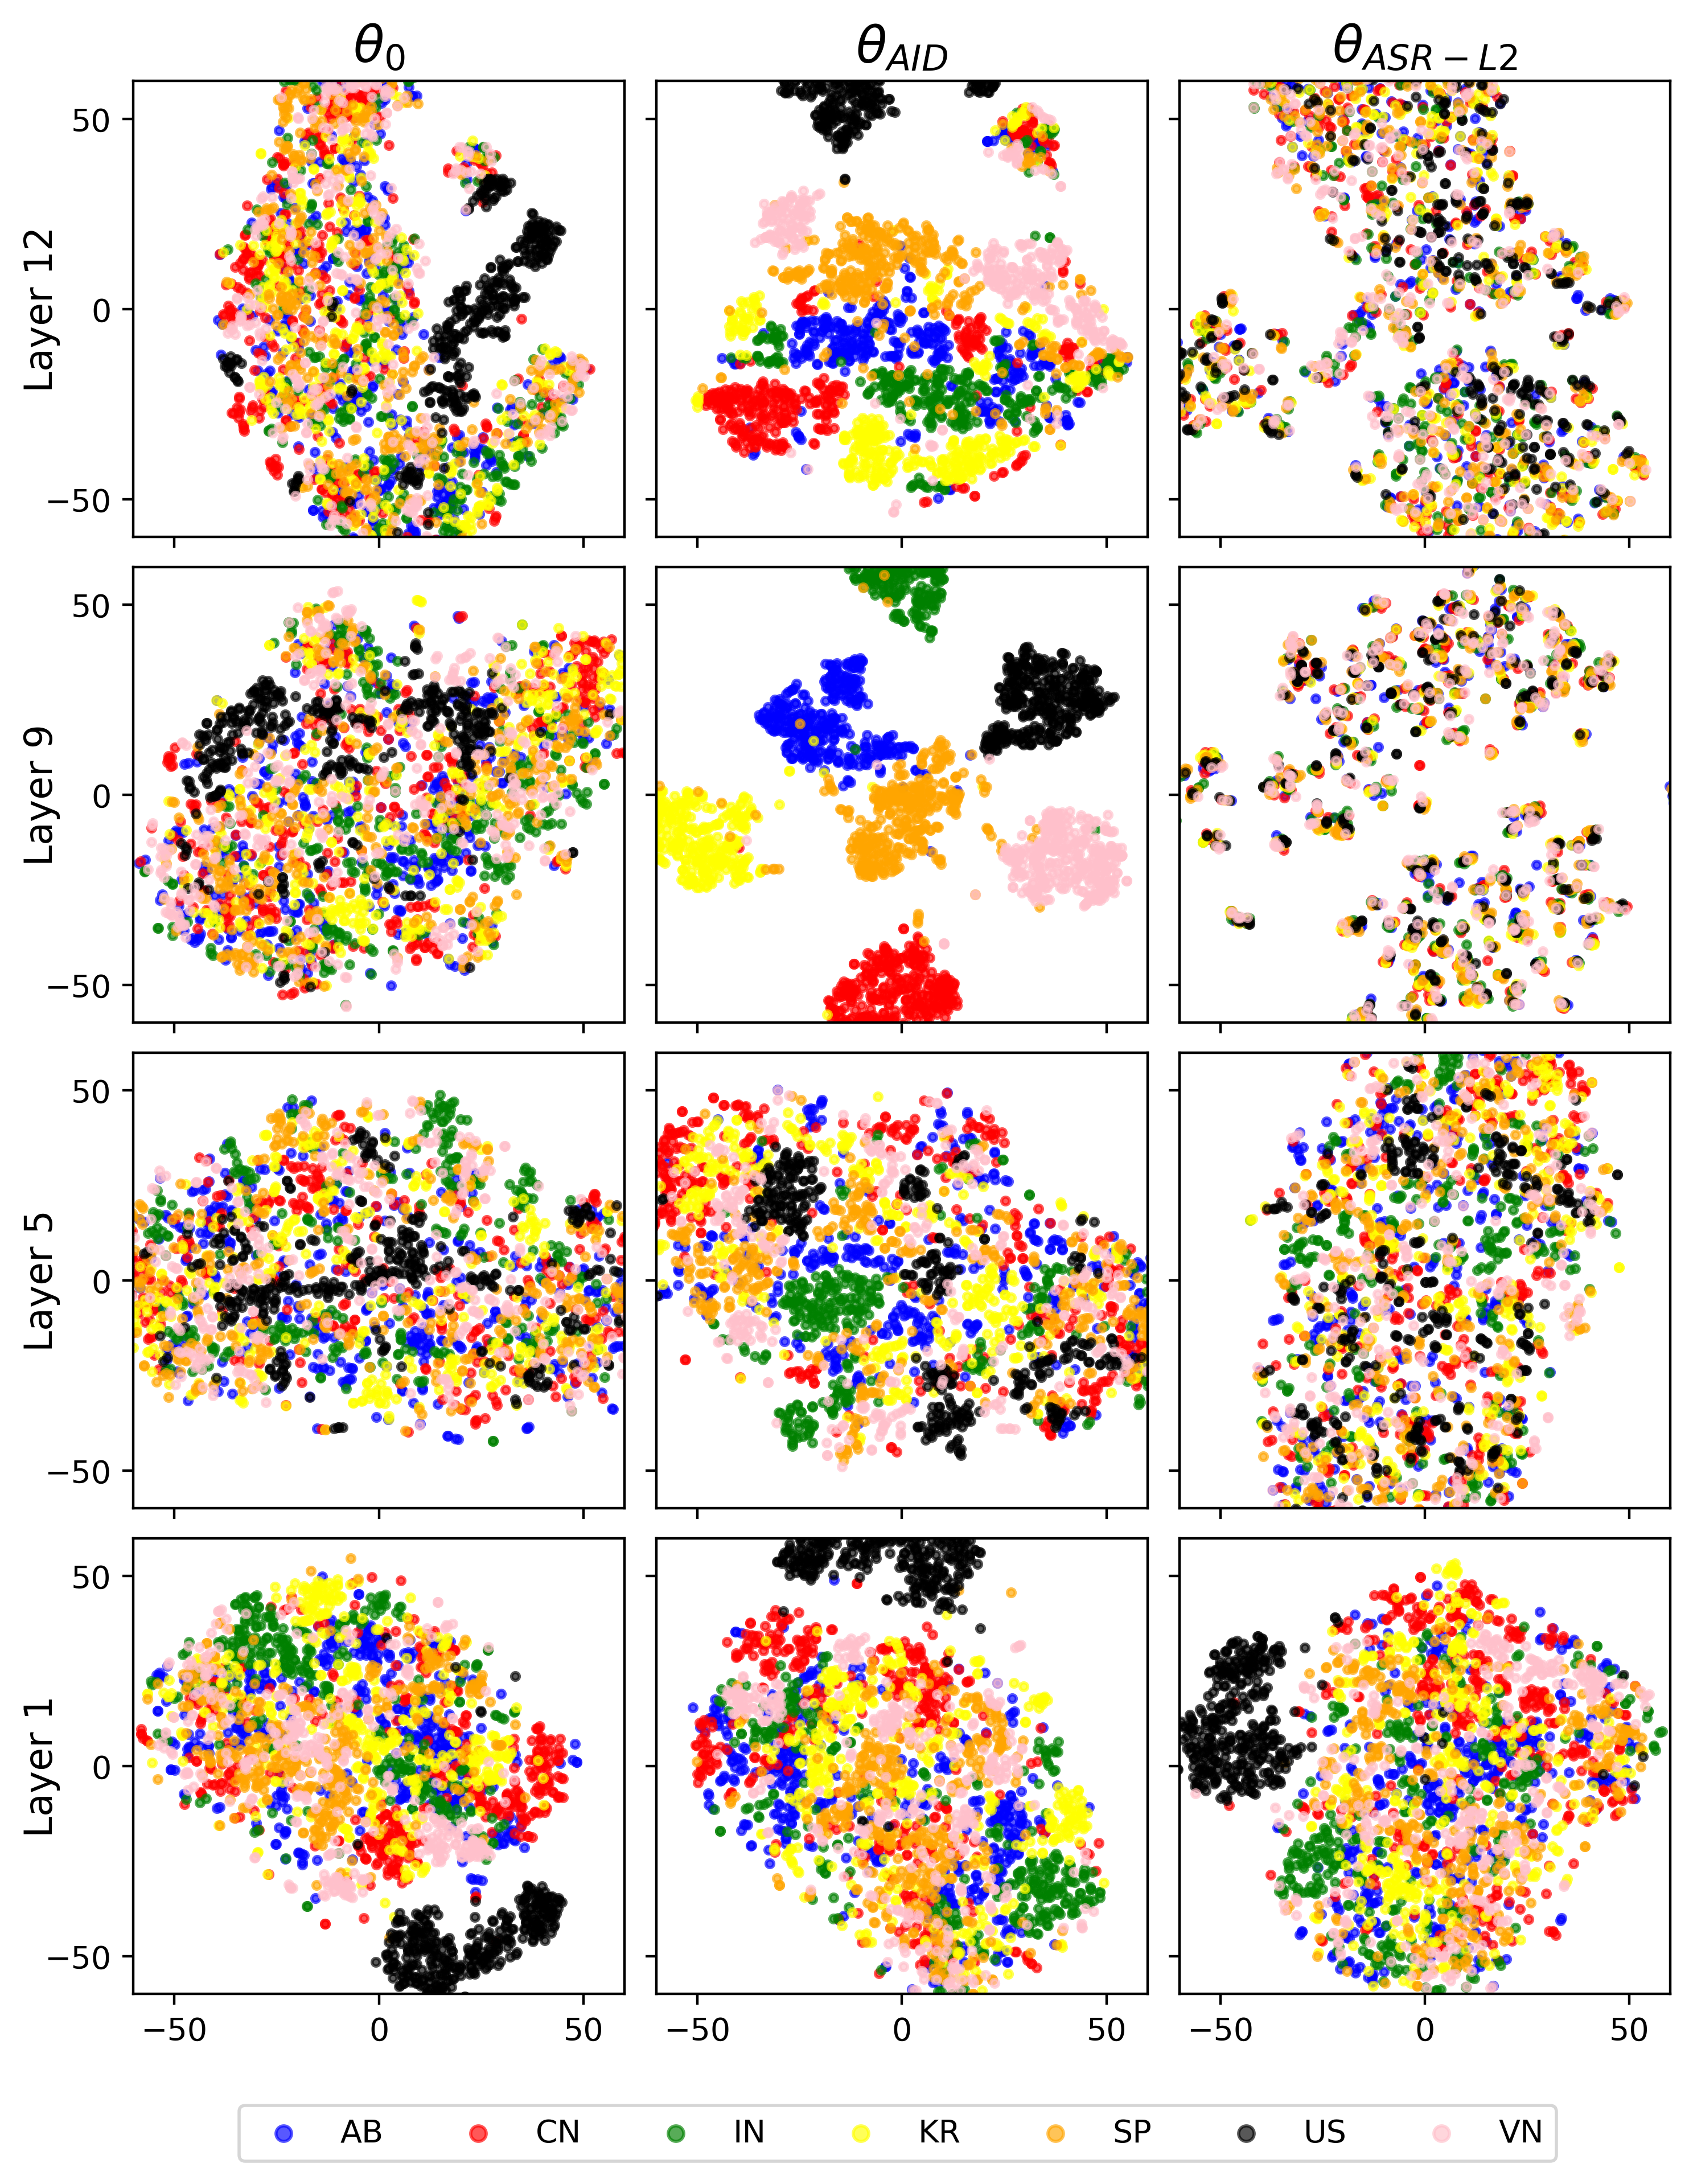
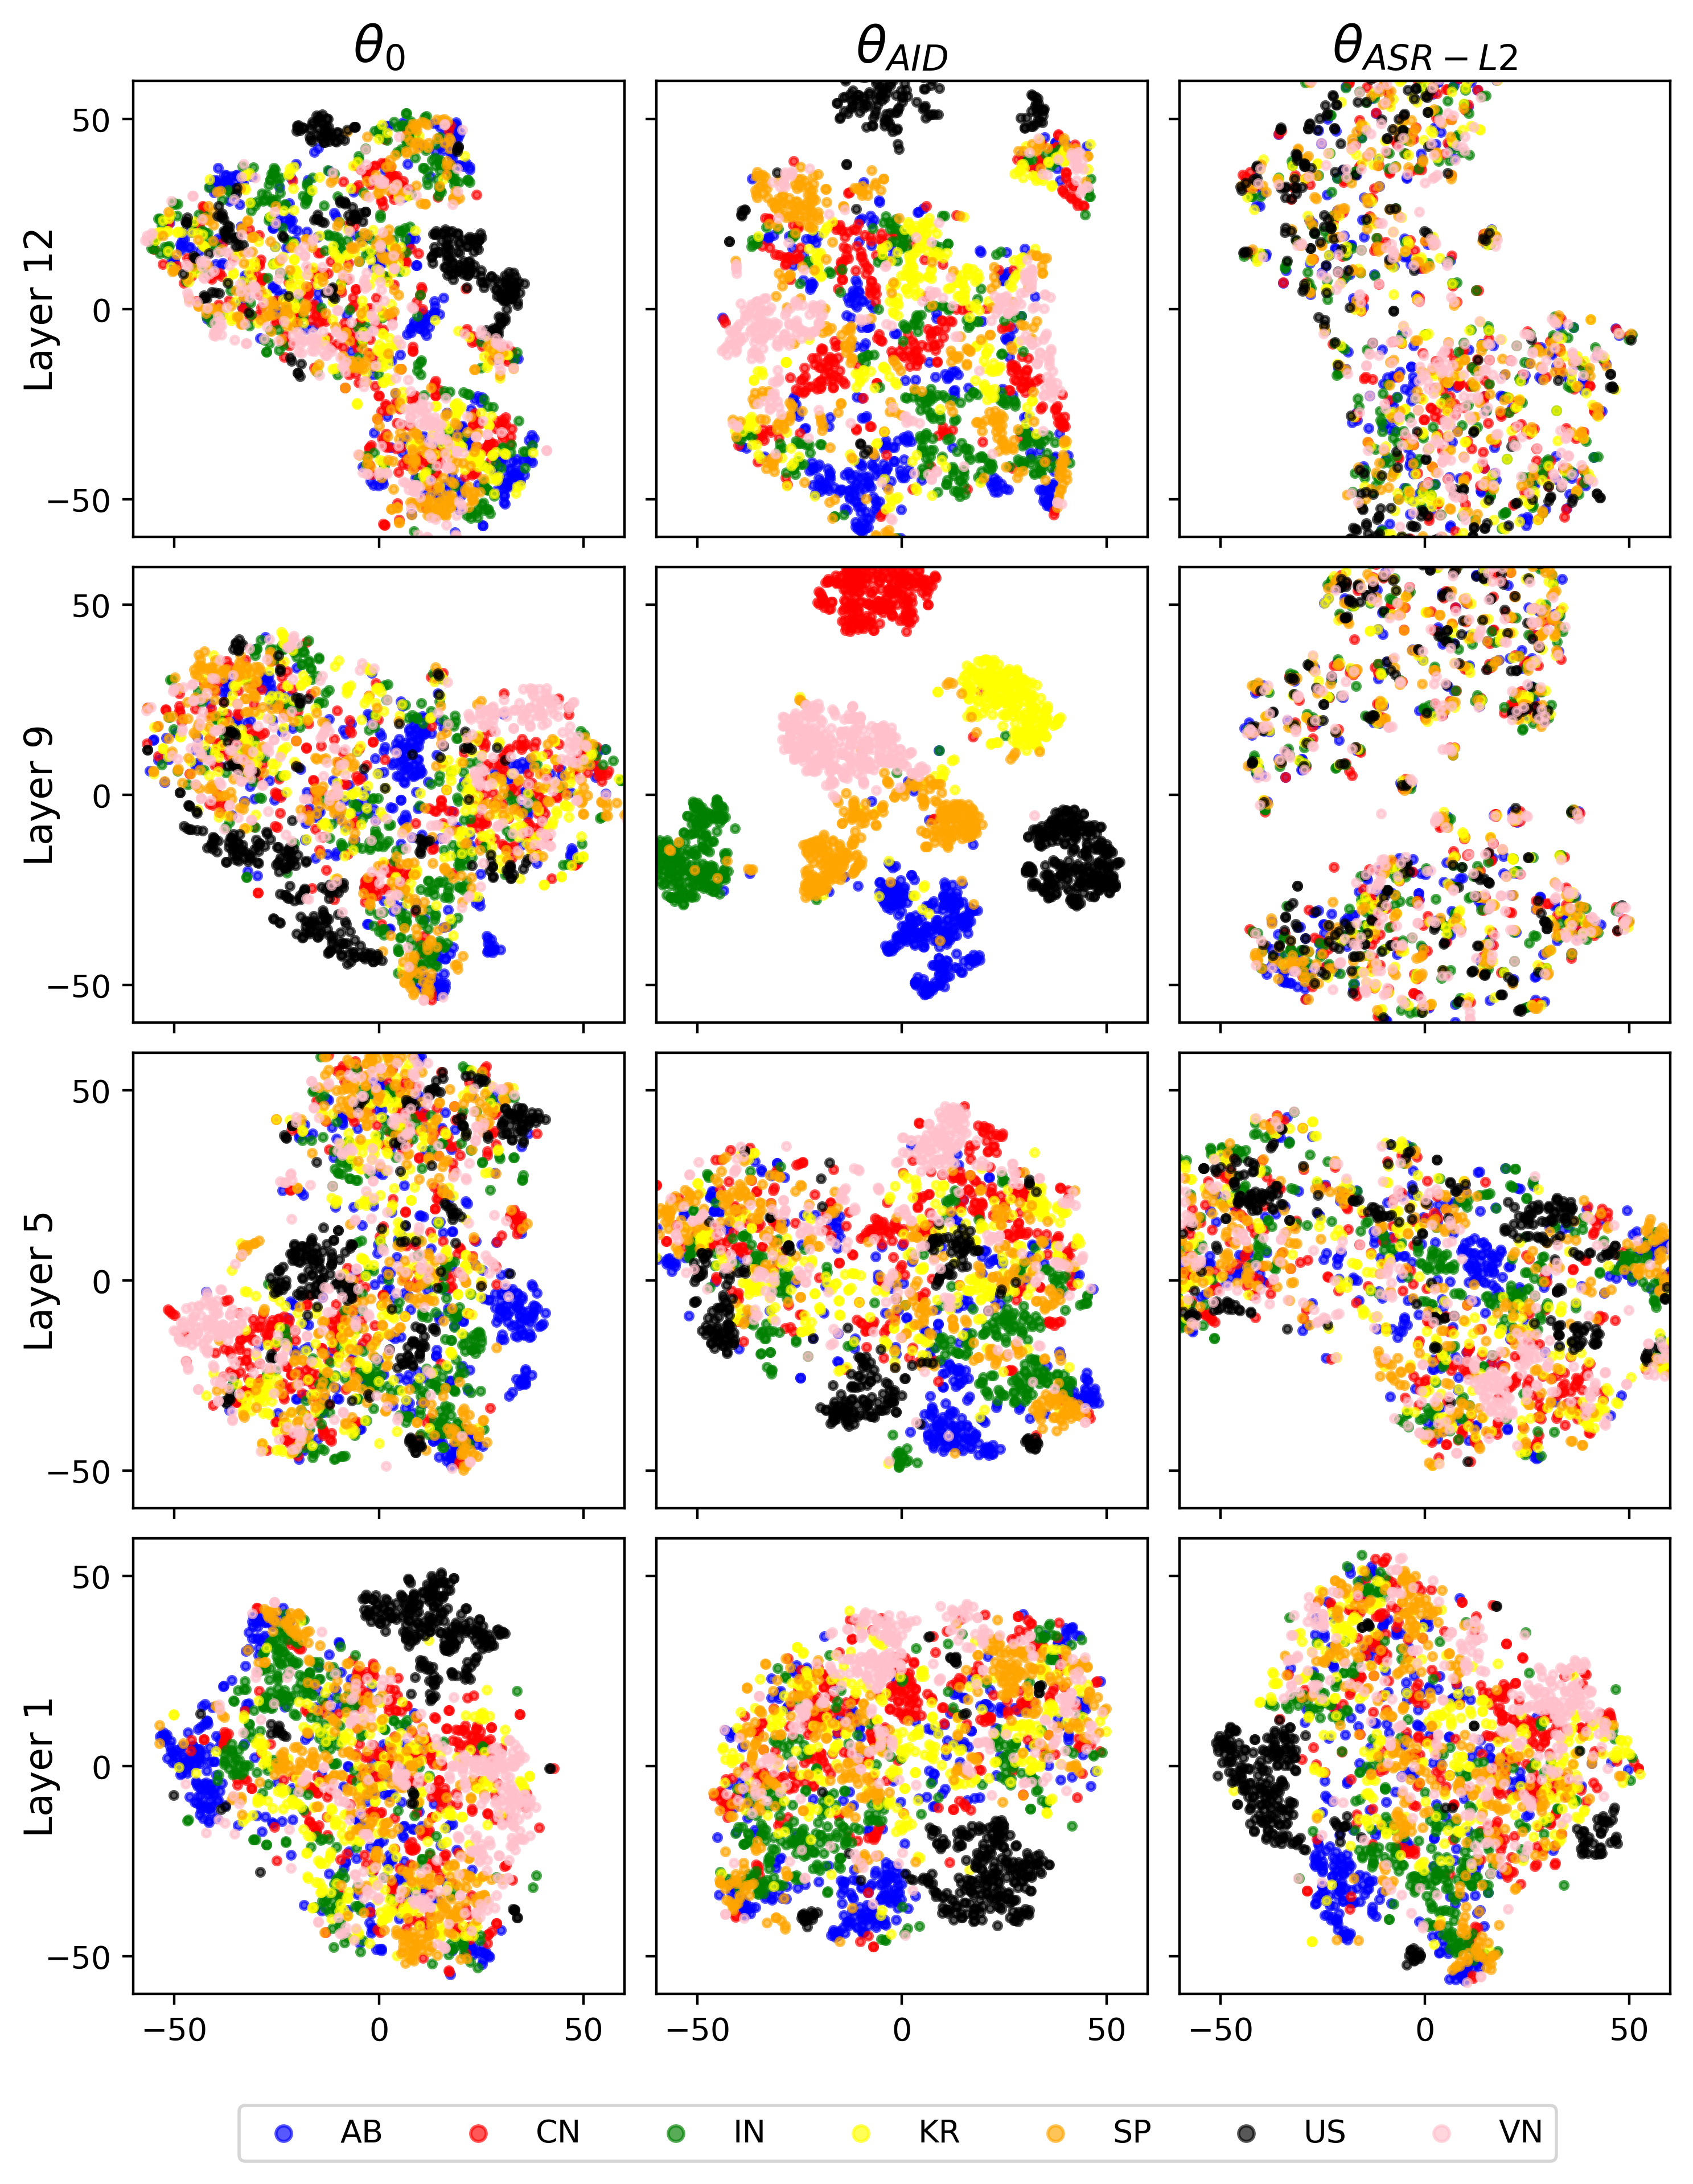
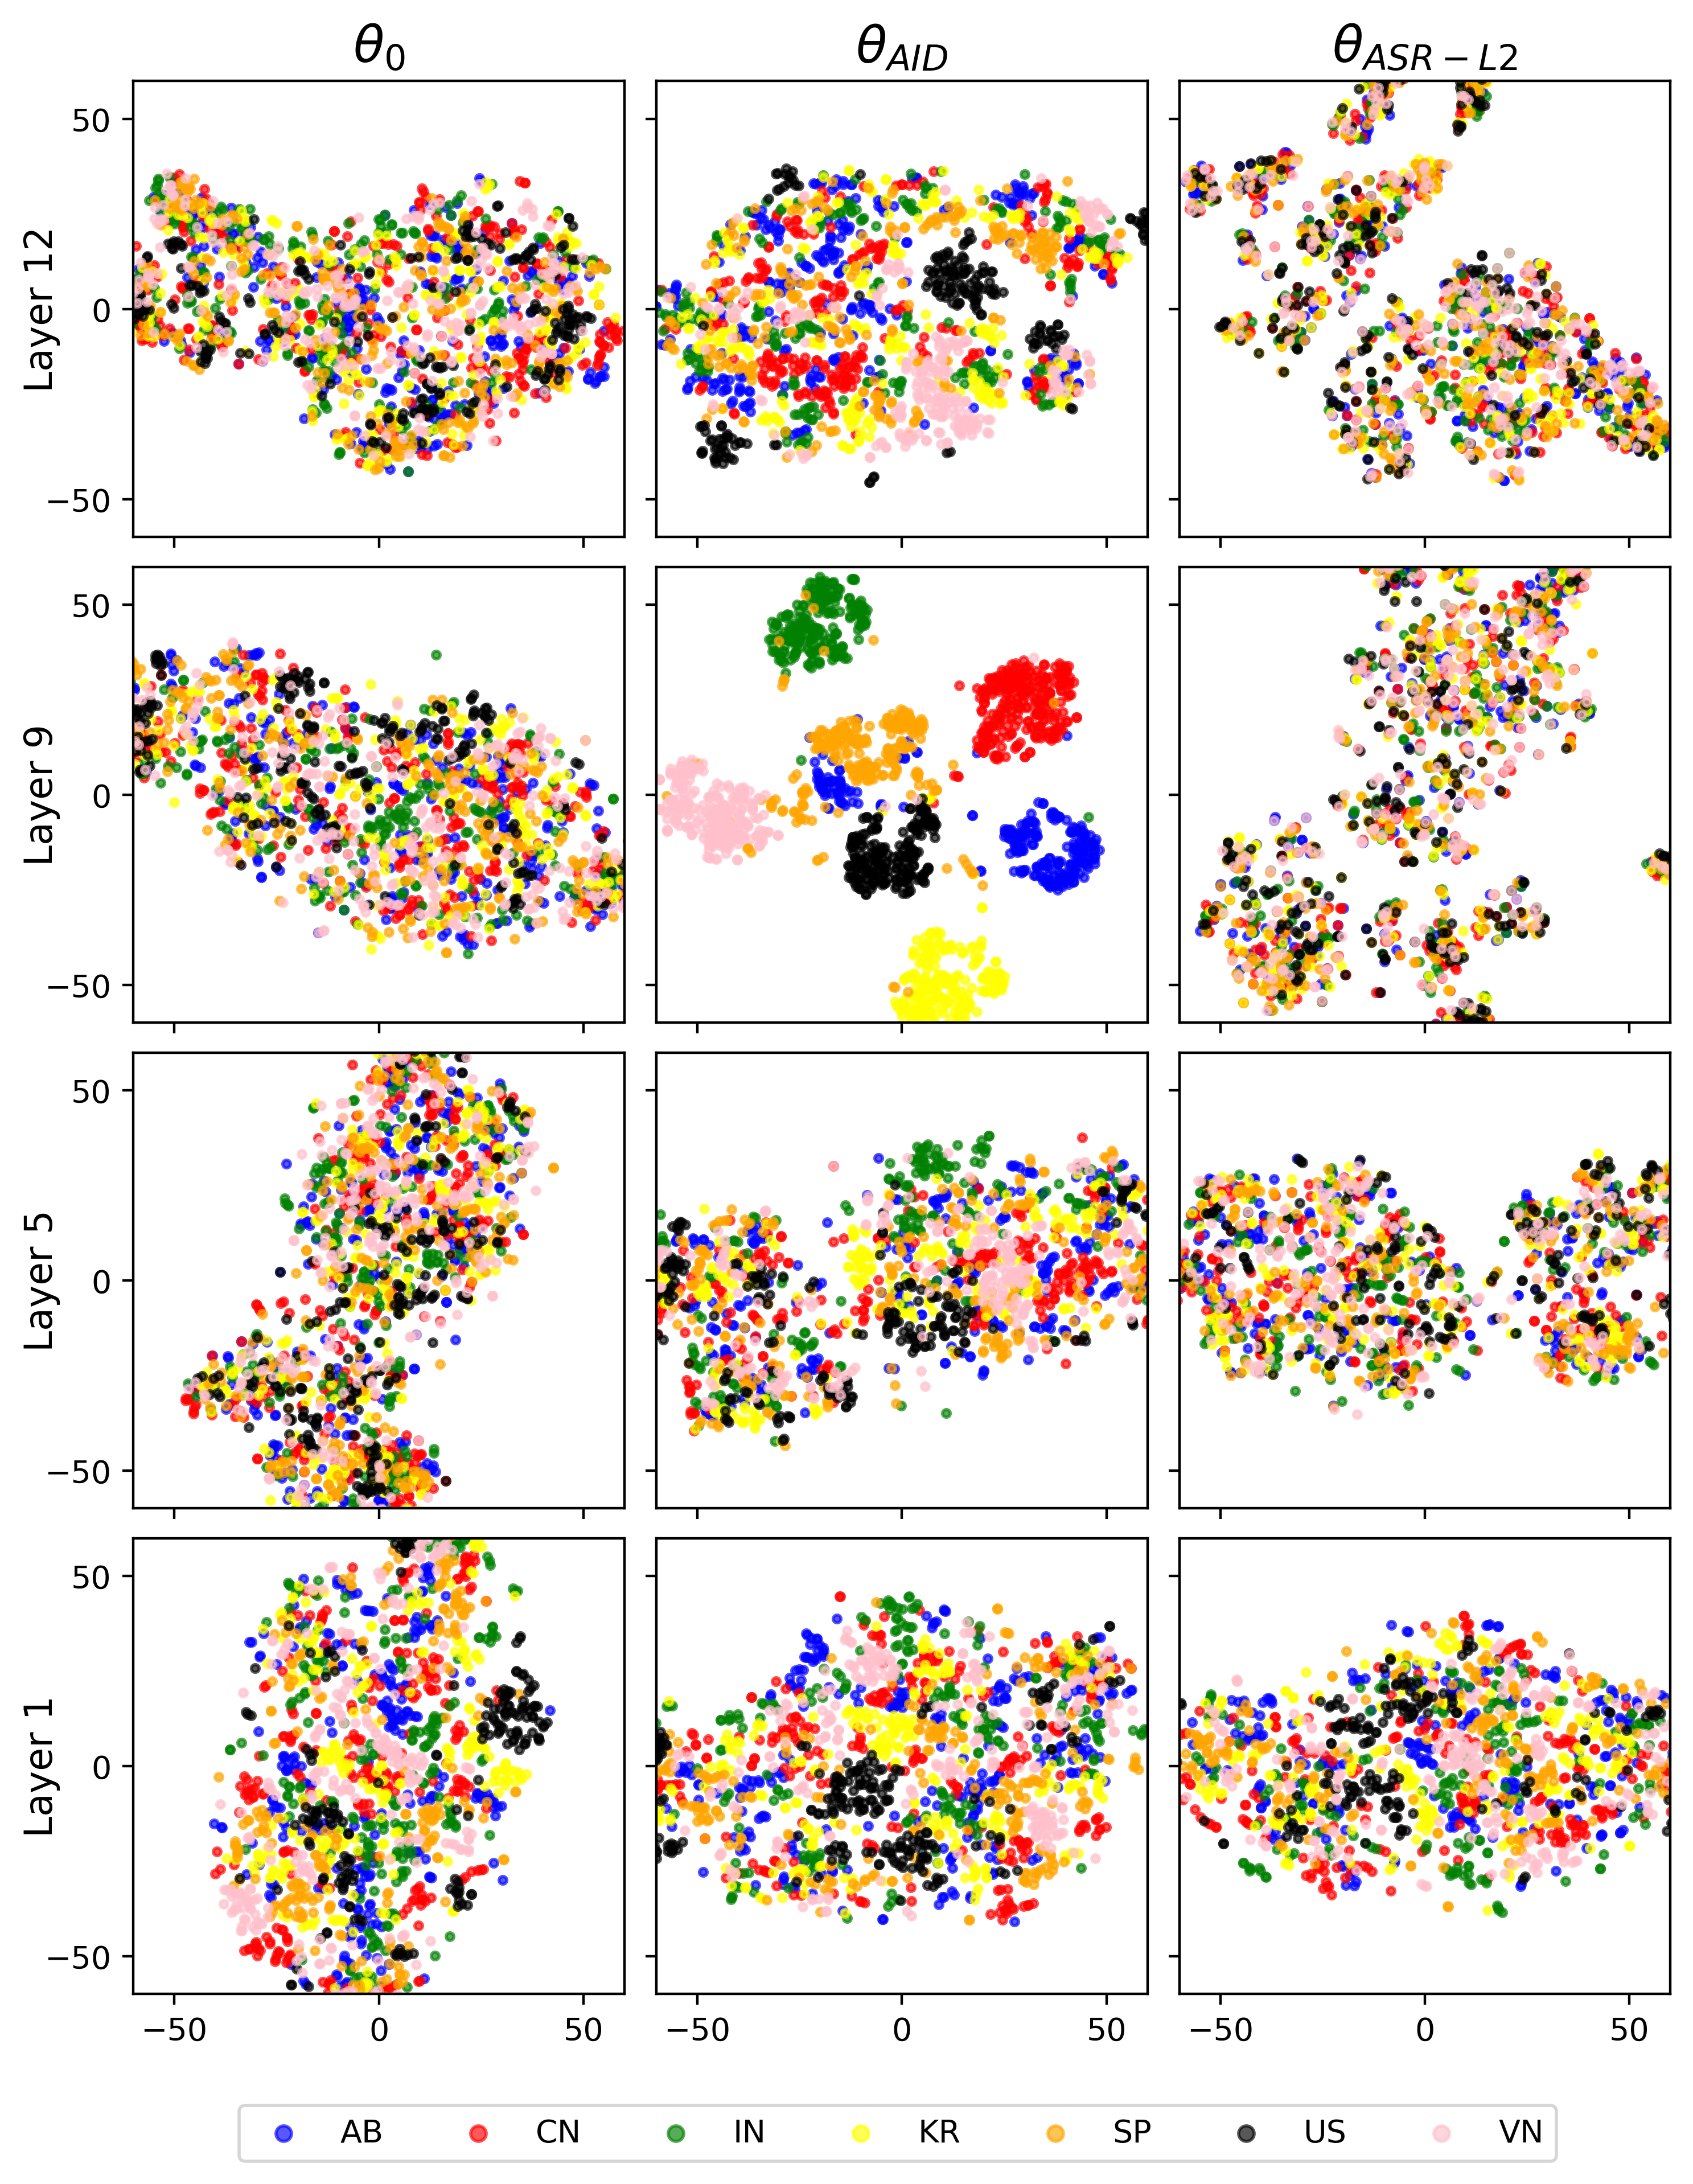
1. The full list of CCA and MSE scores on the 7 accents: AB, CN, IN, KR, SP, US, VN.
(Click on the buttons to toggle the figure)
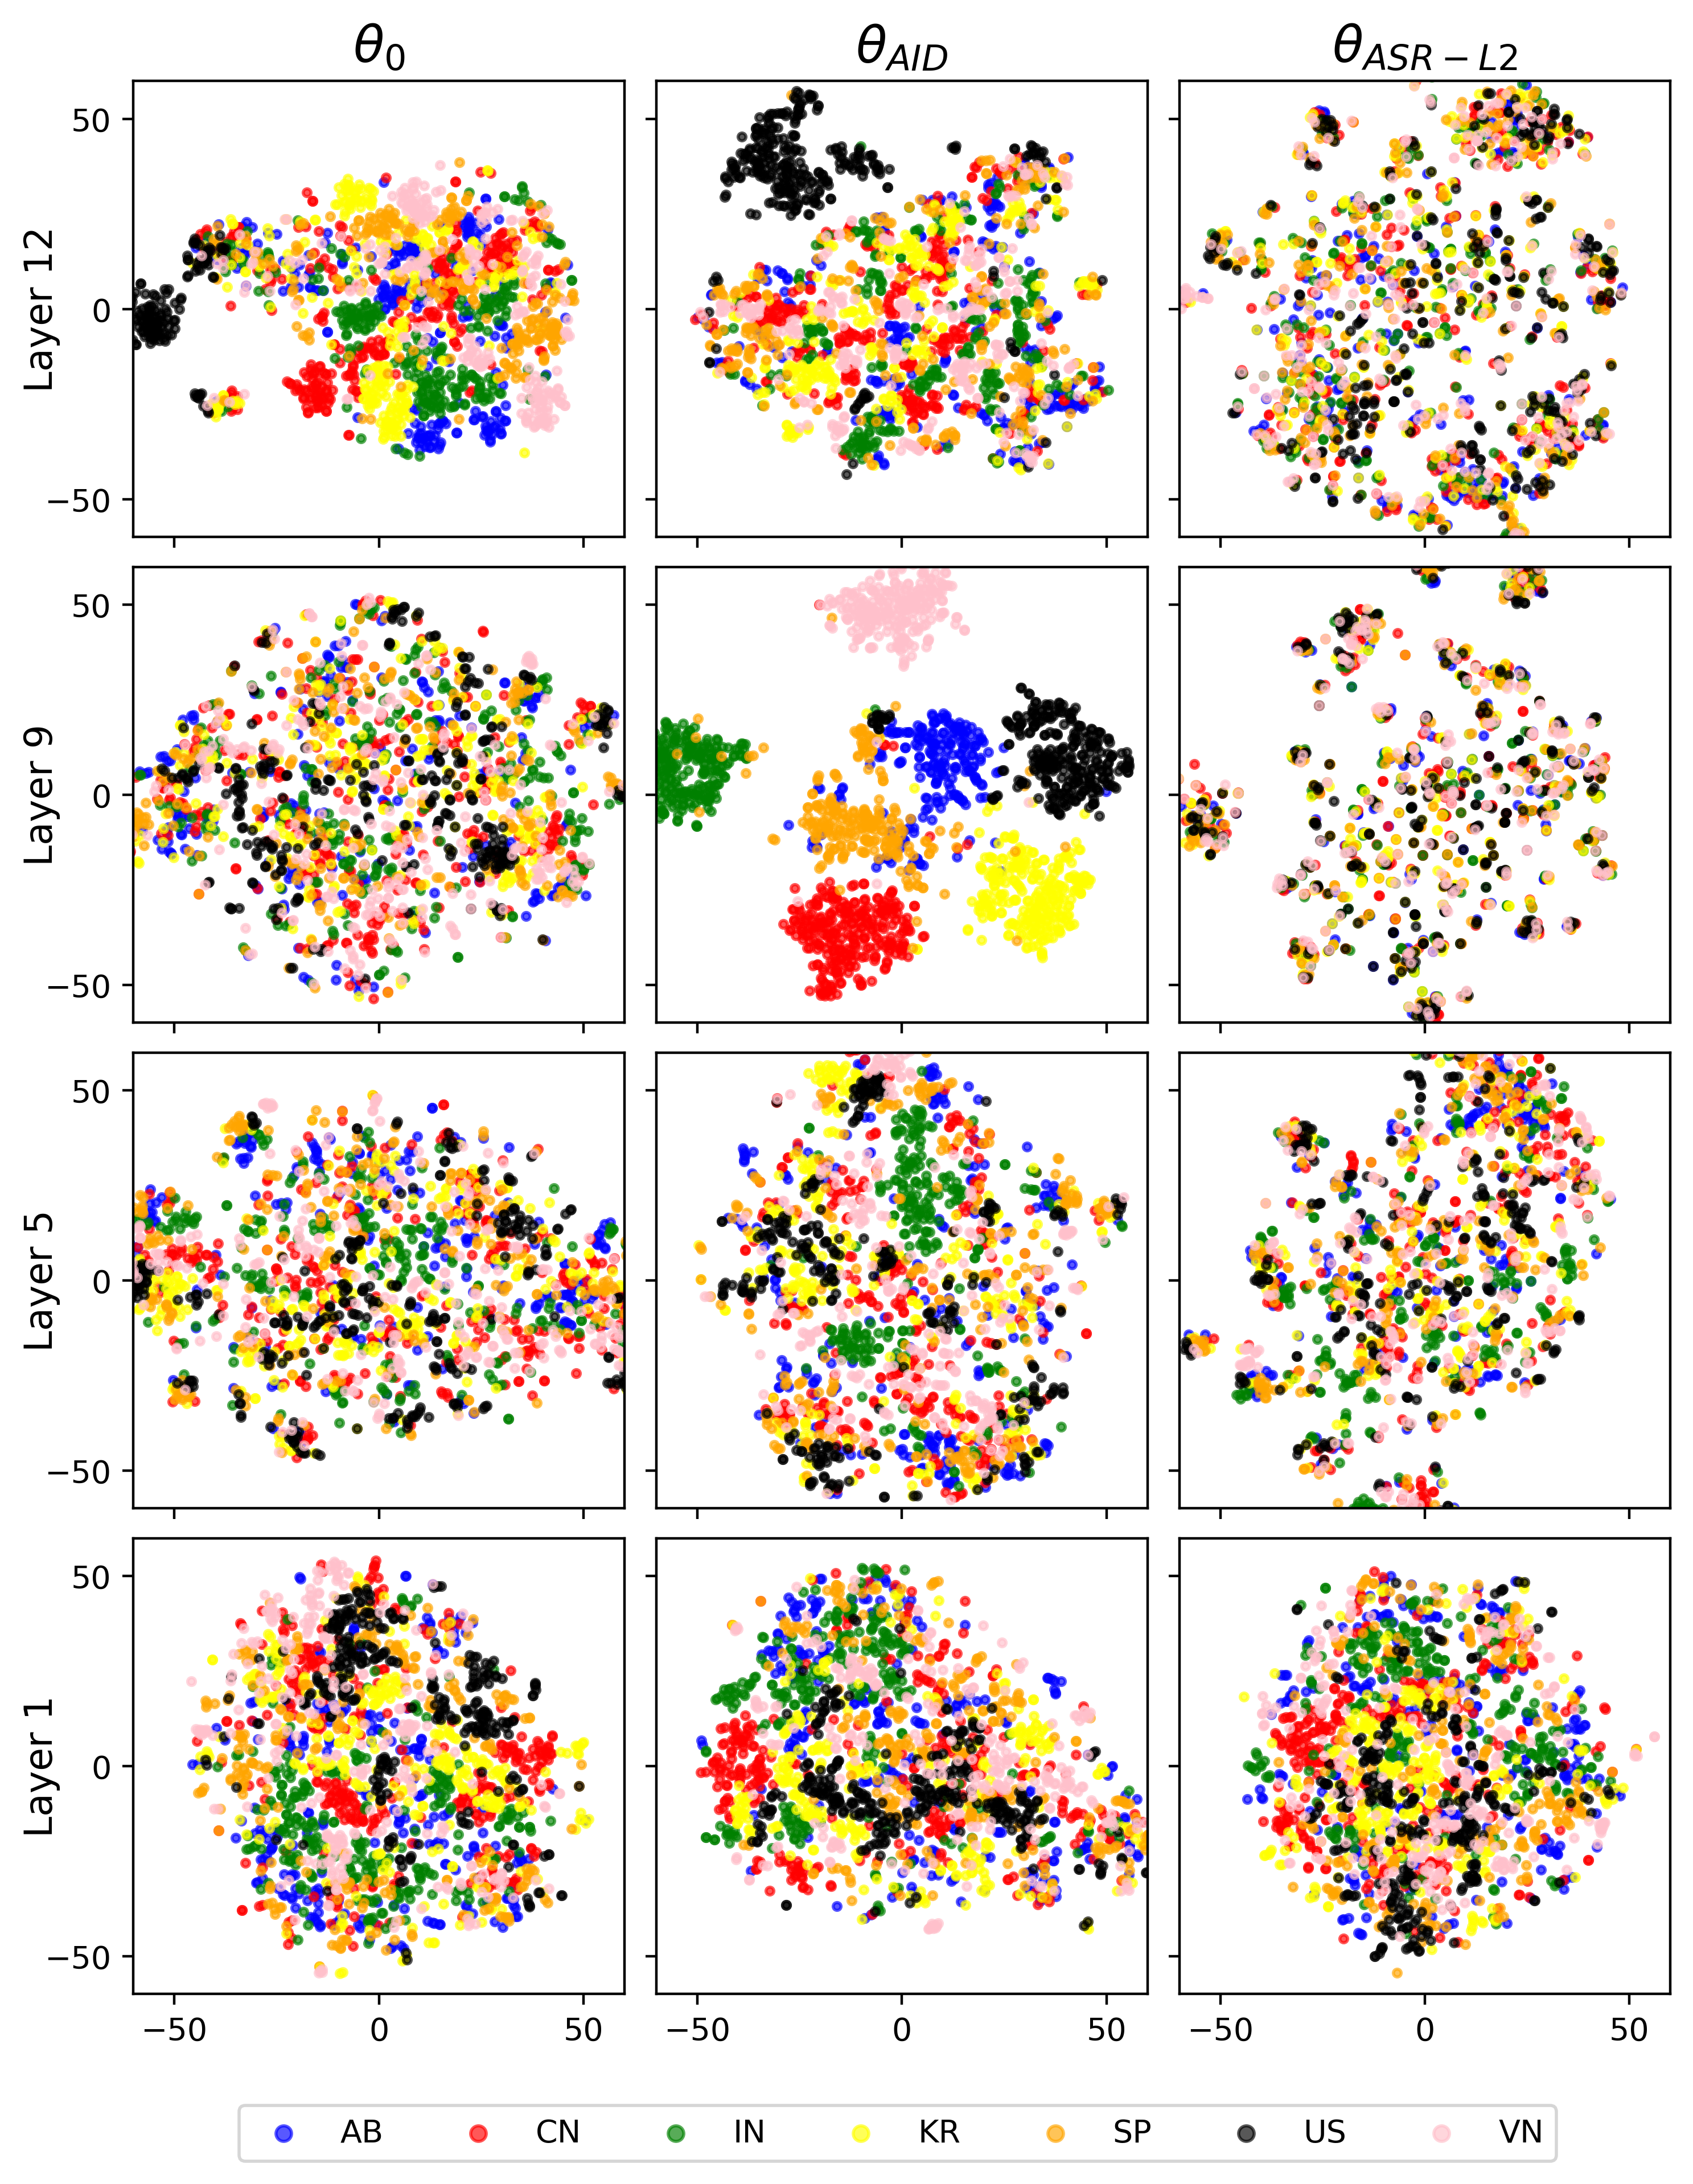
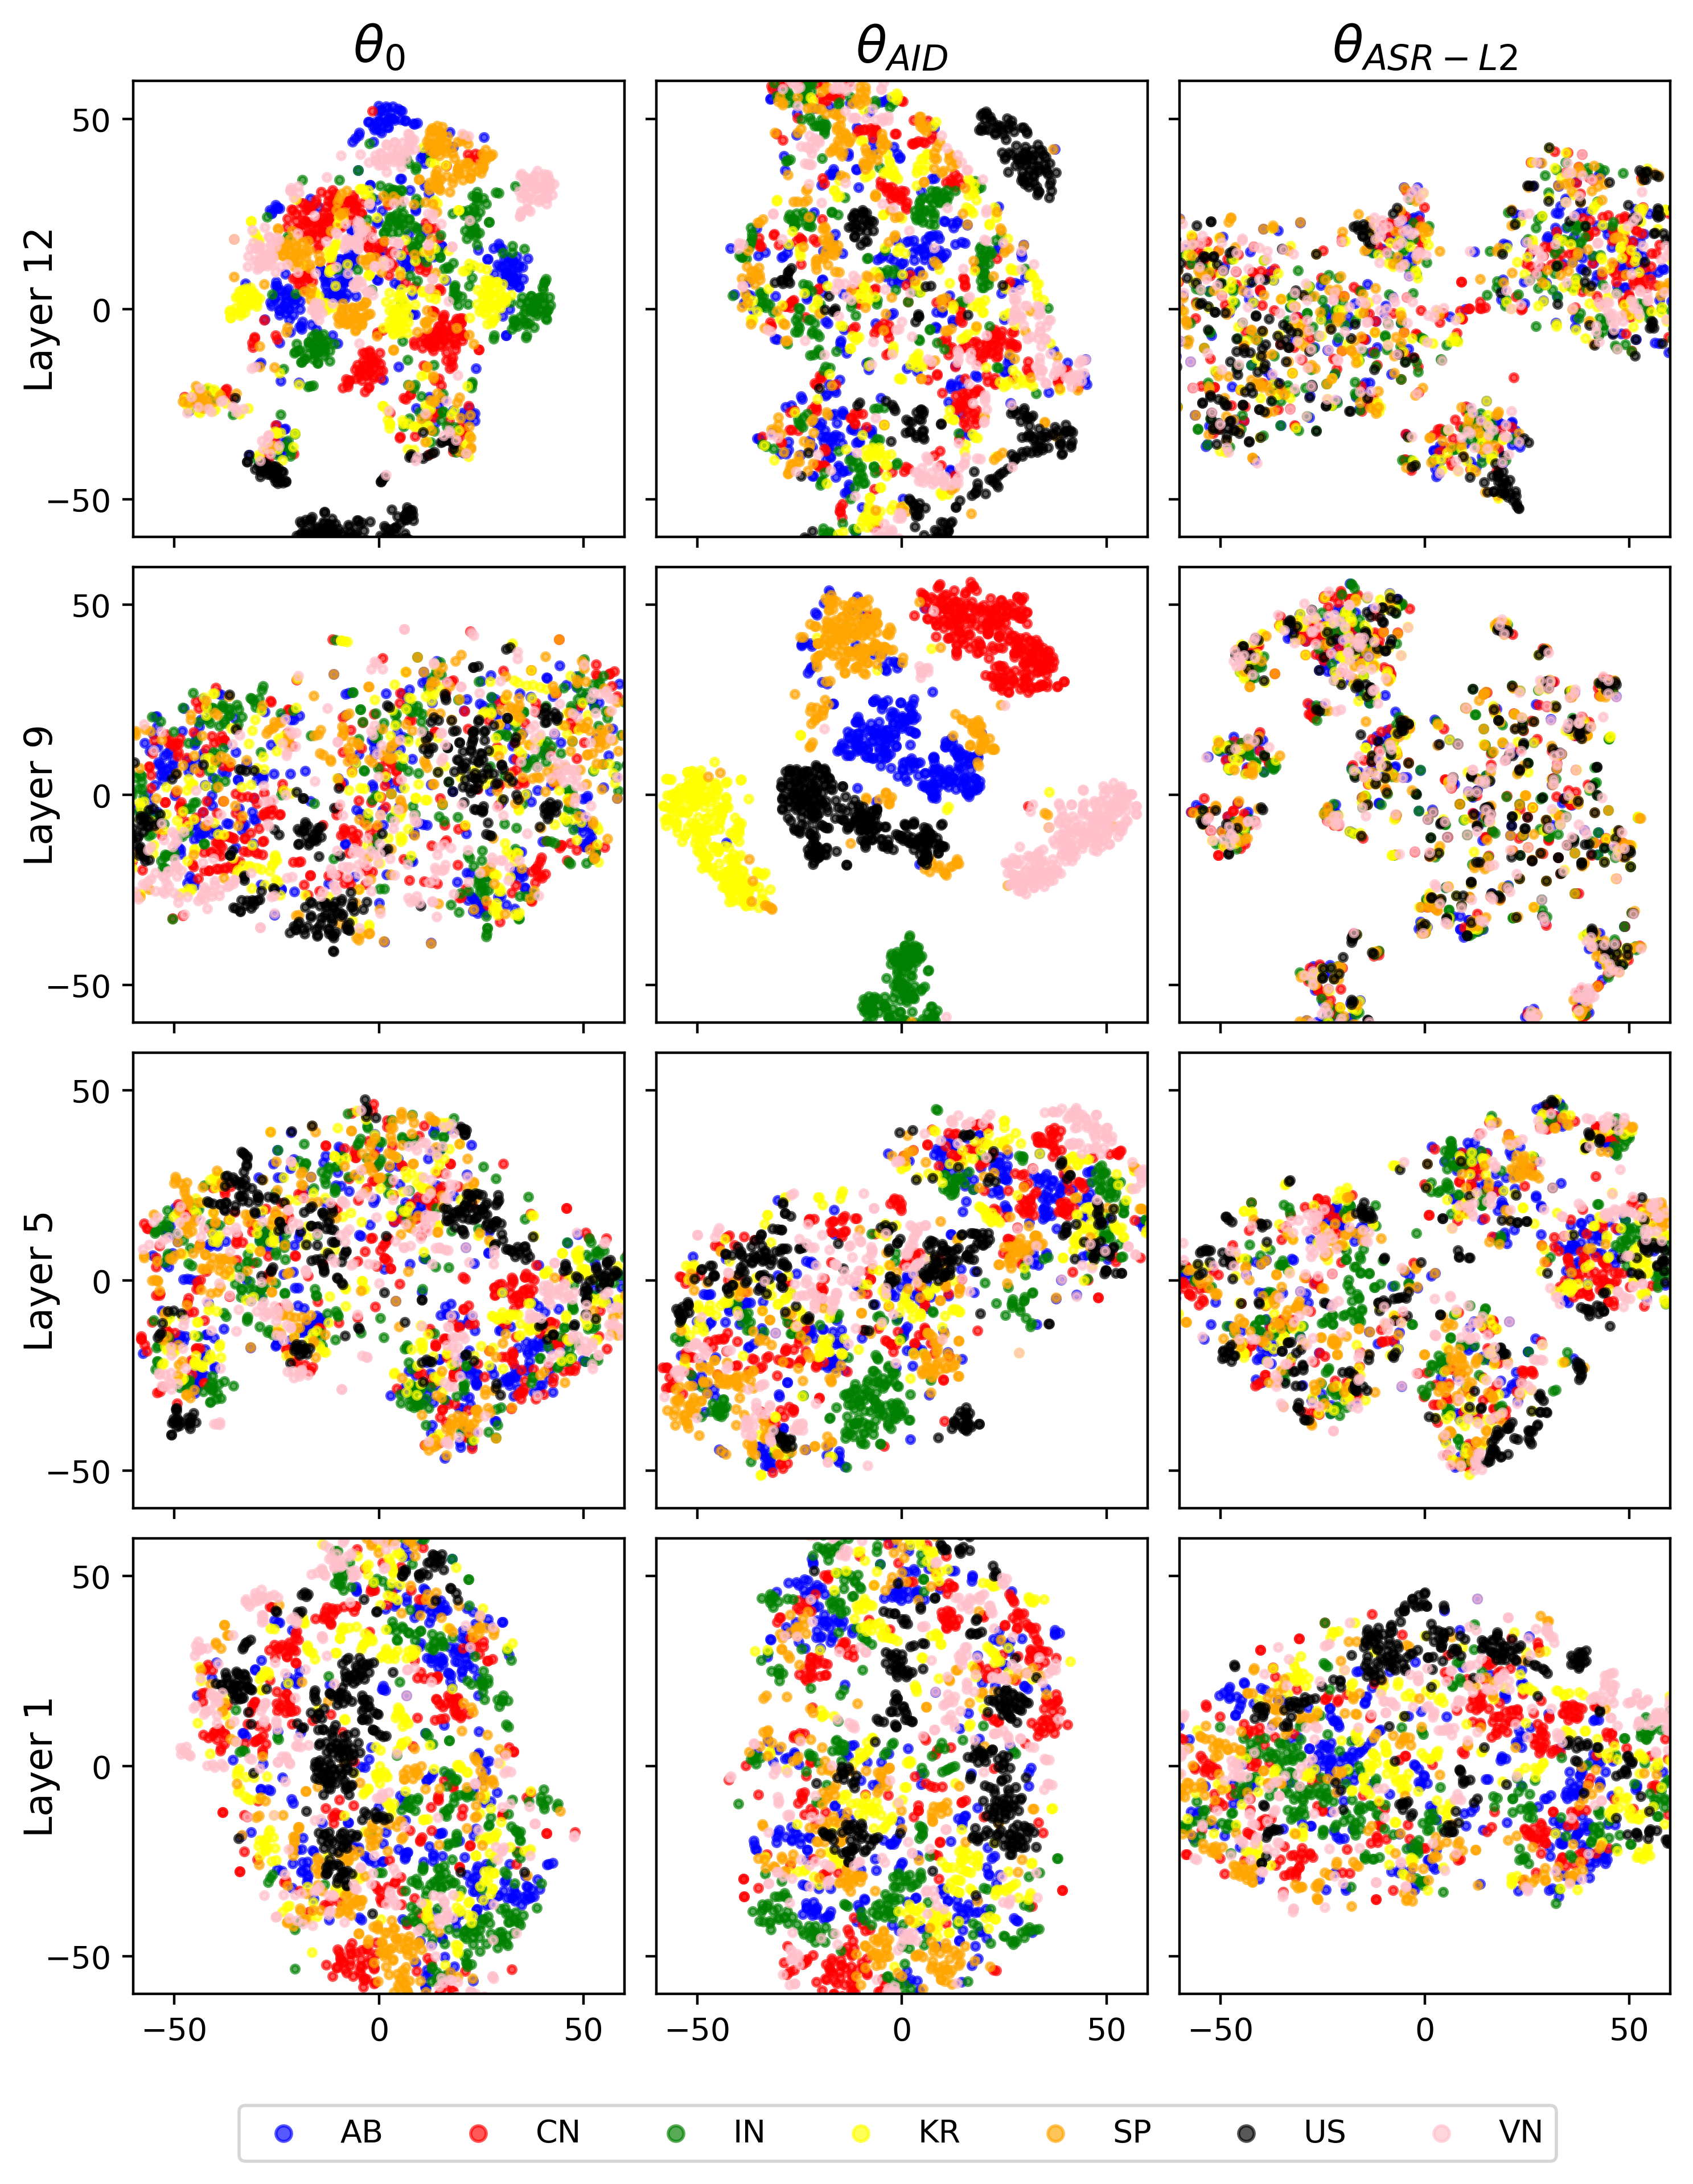
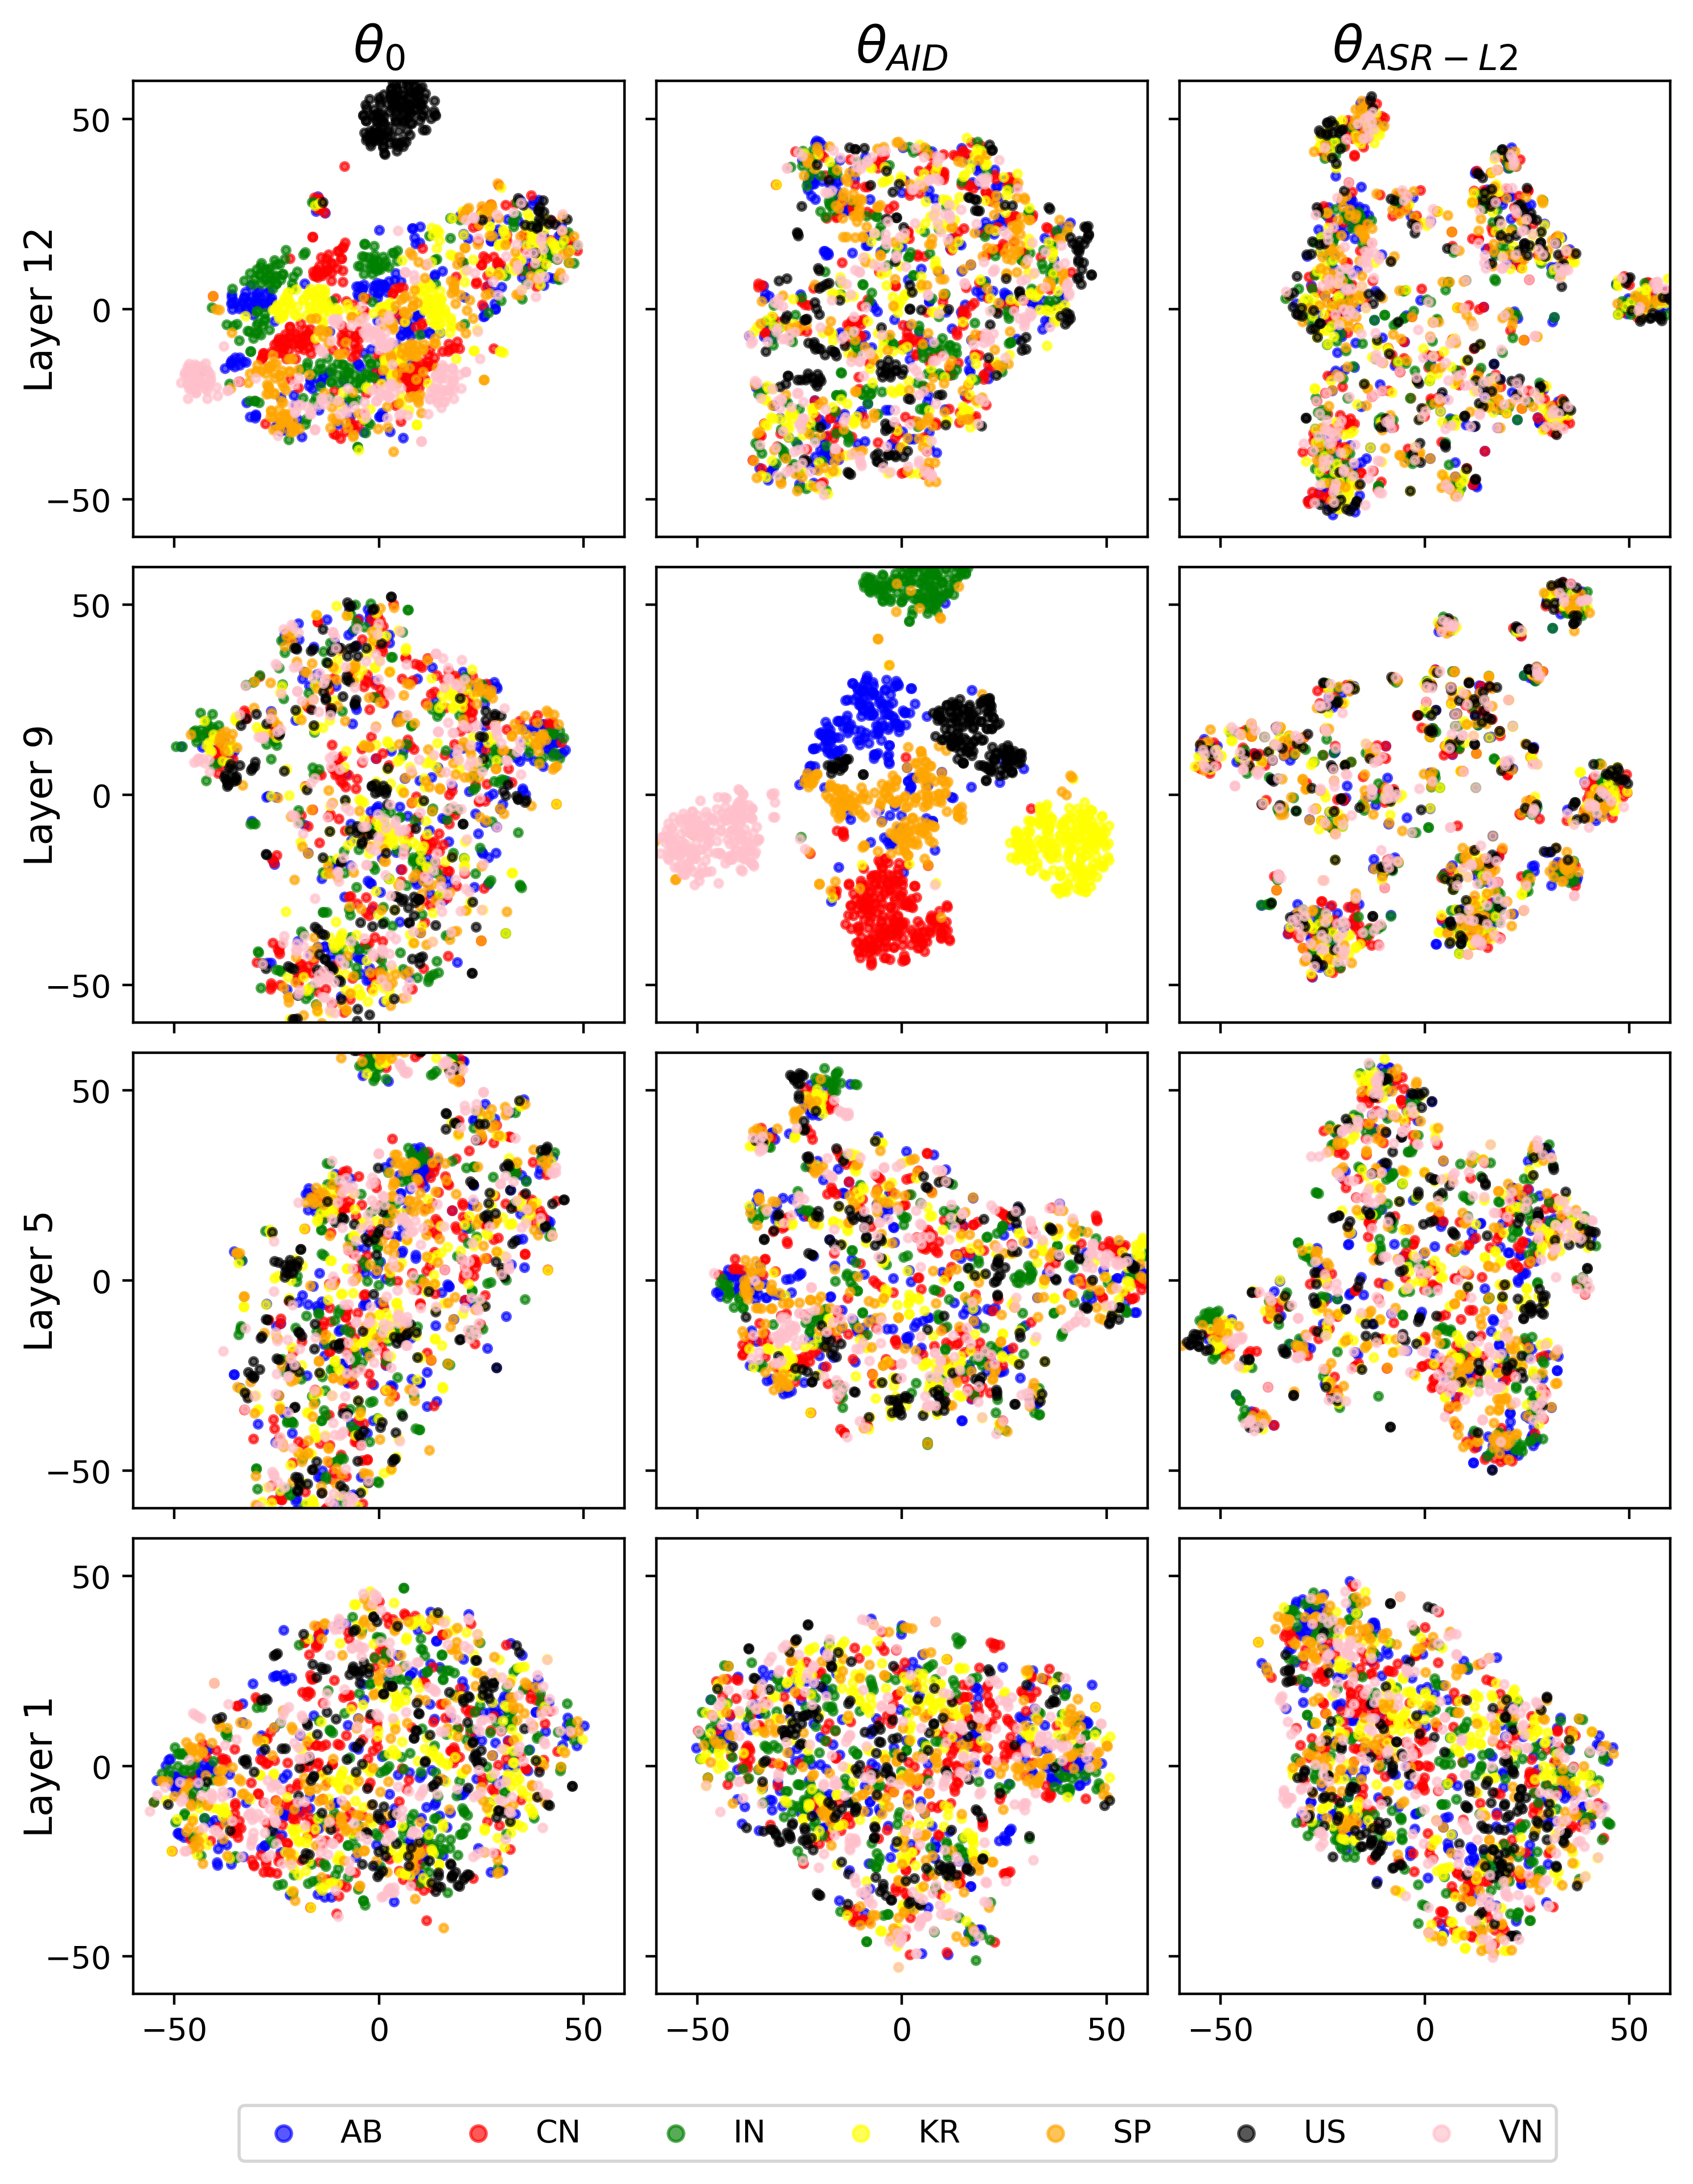
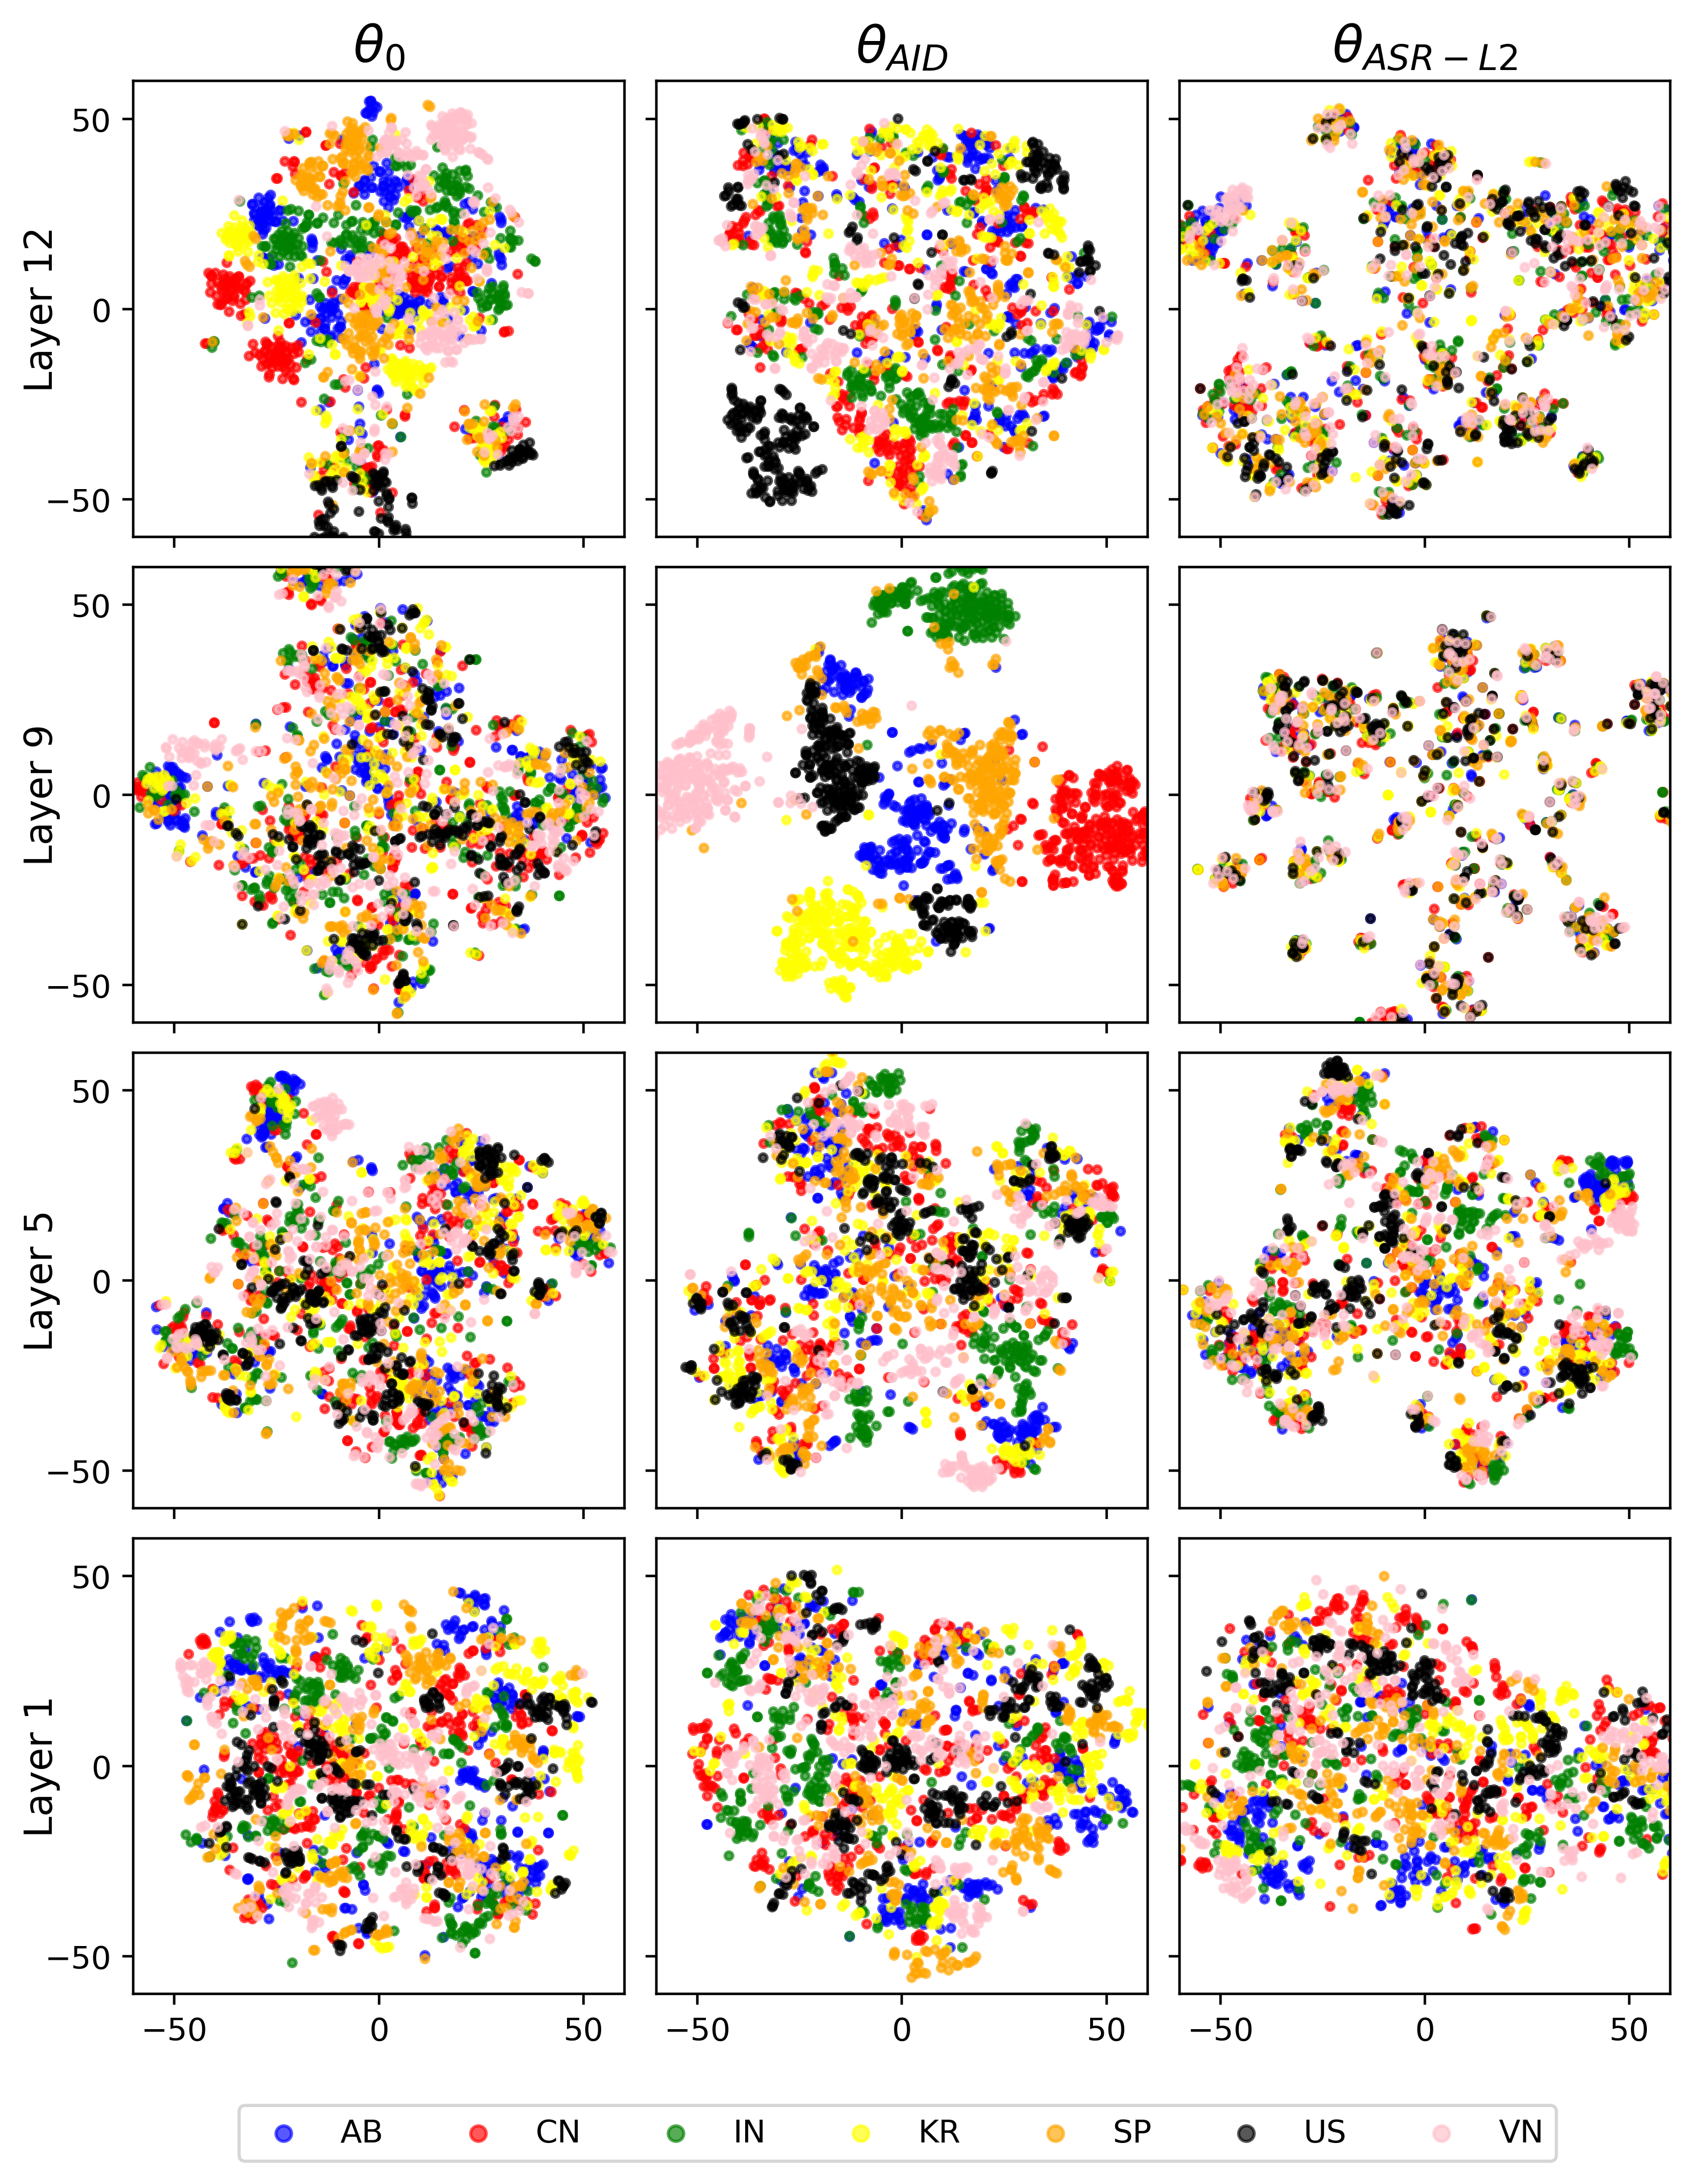
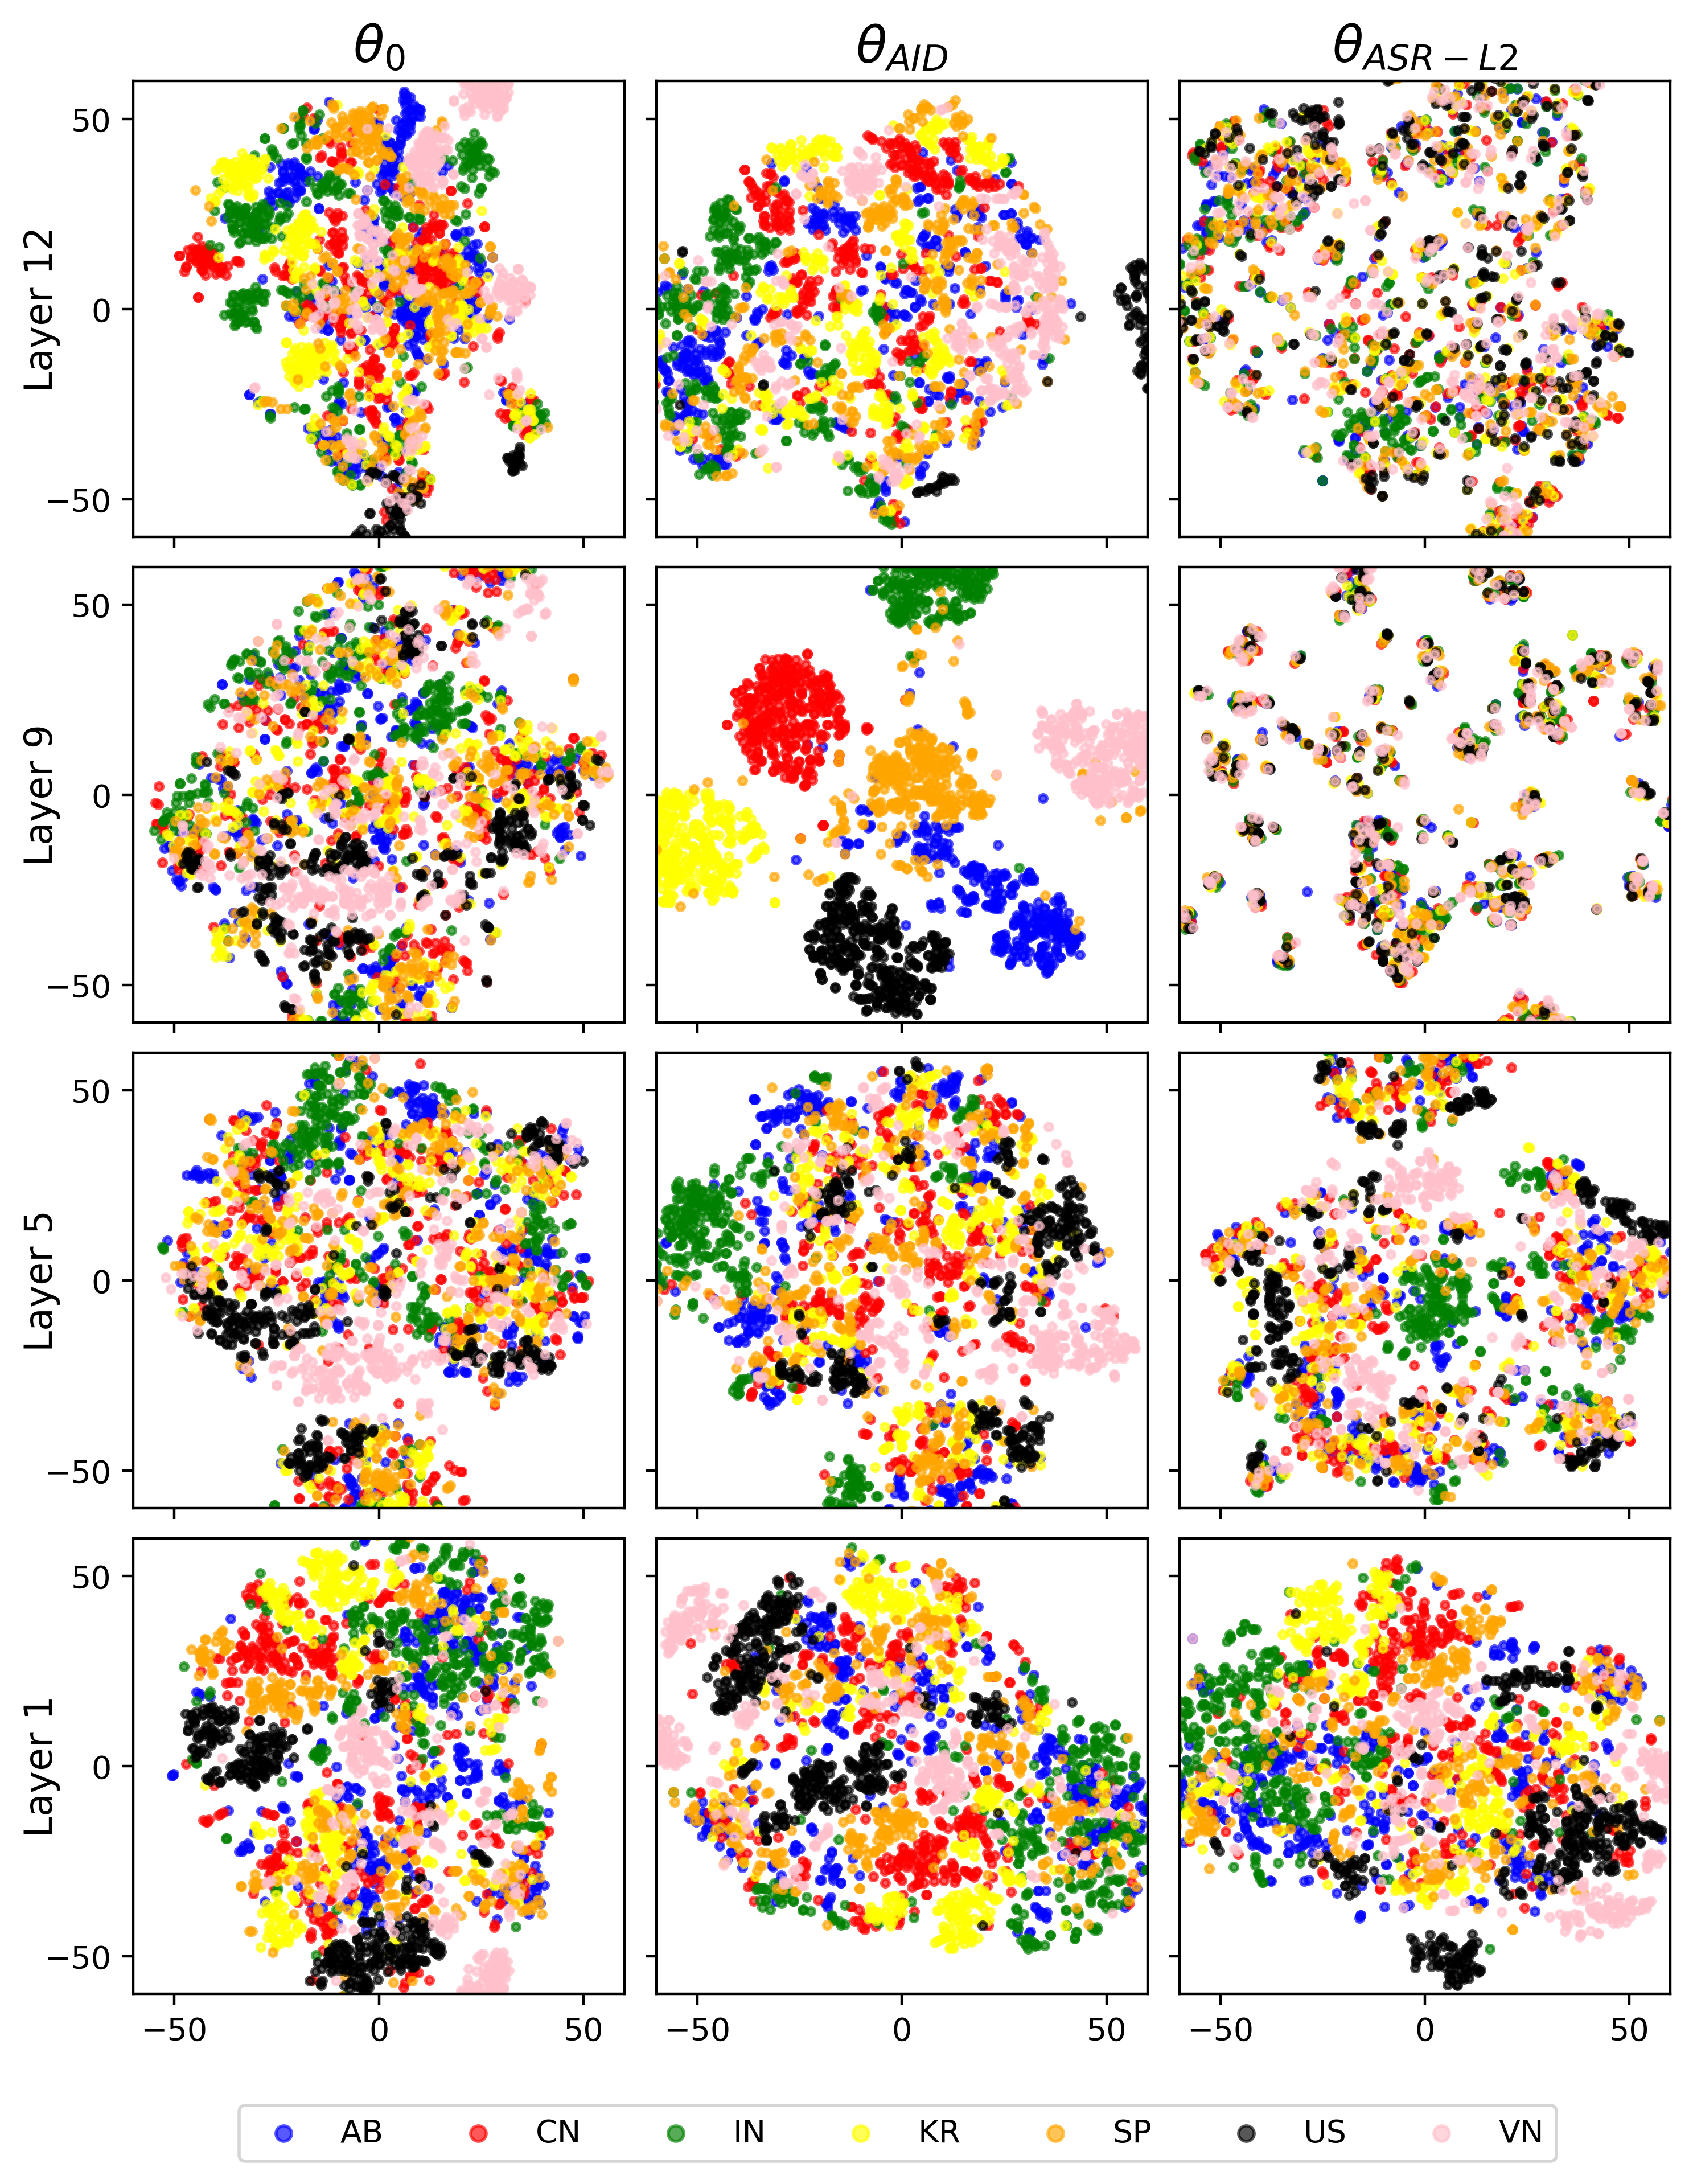
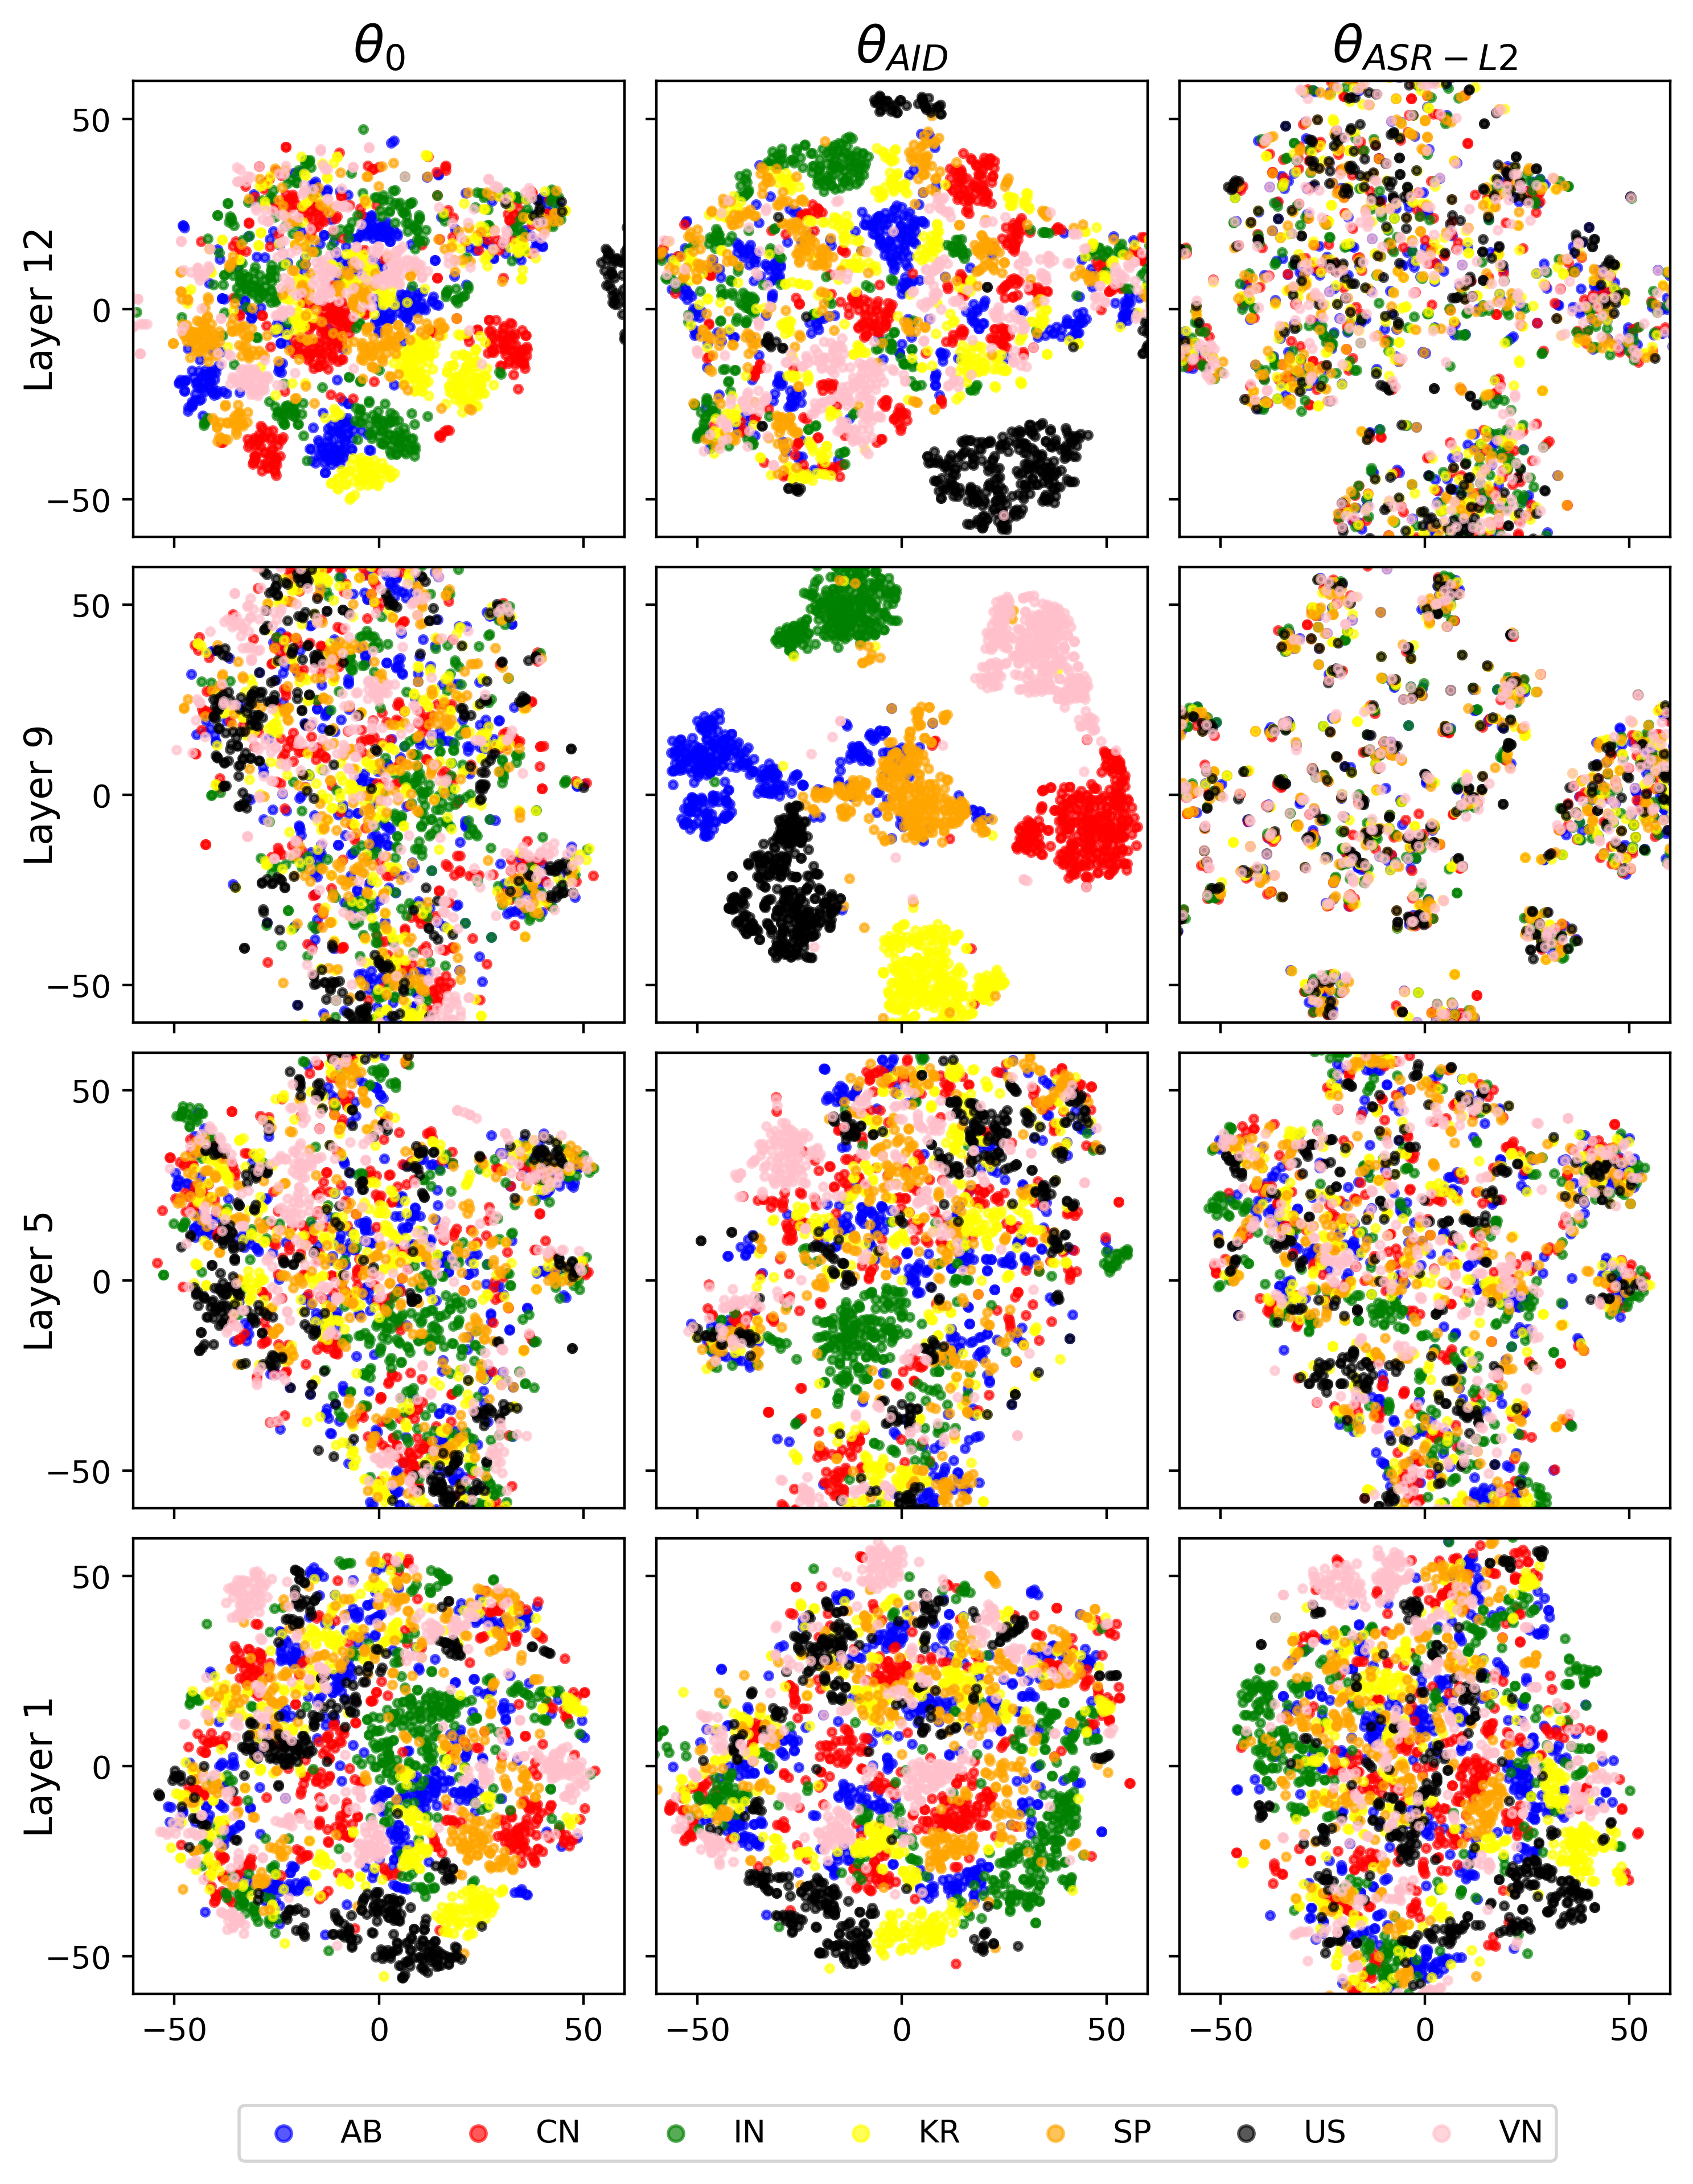
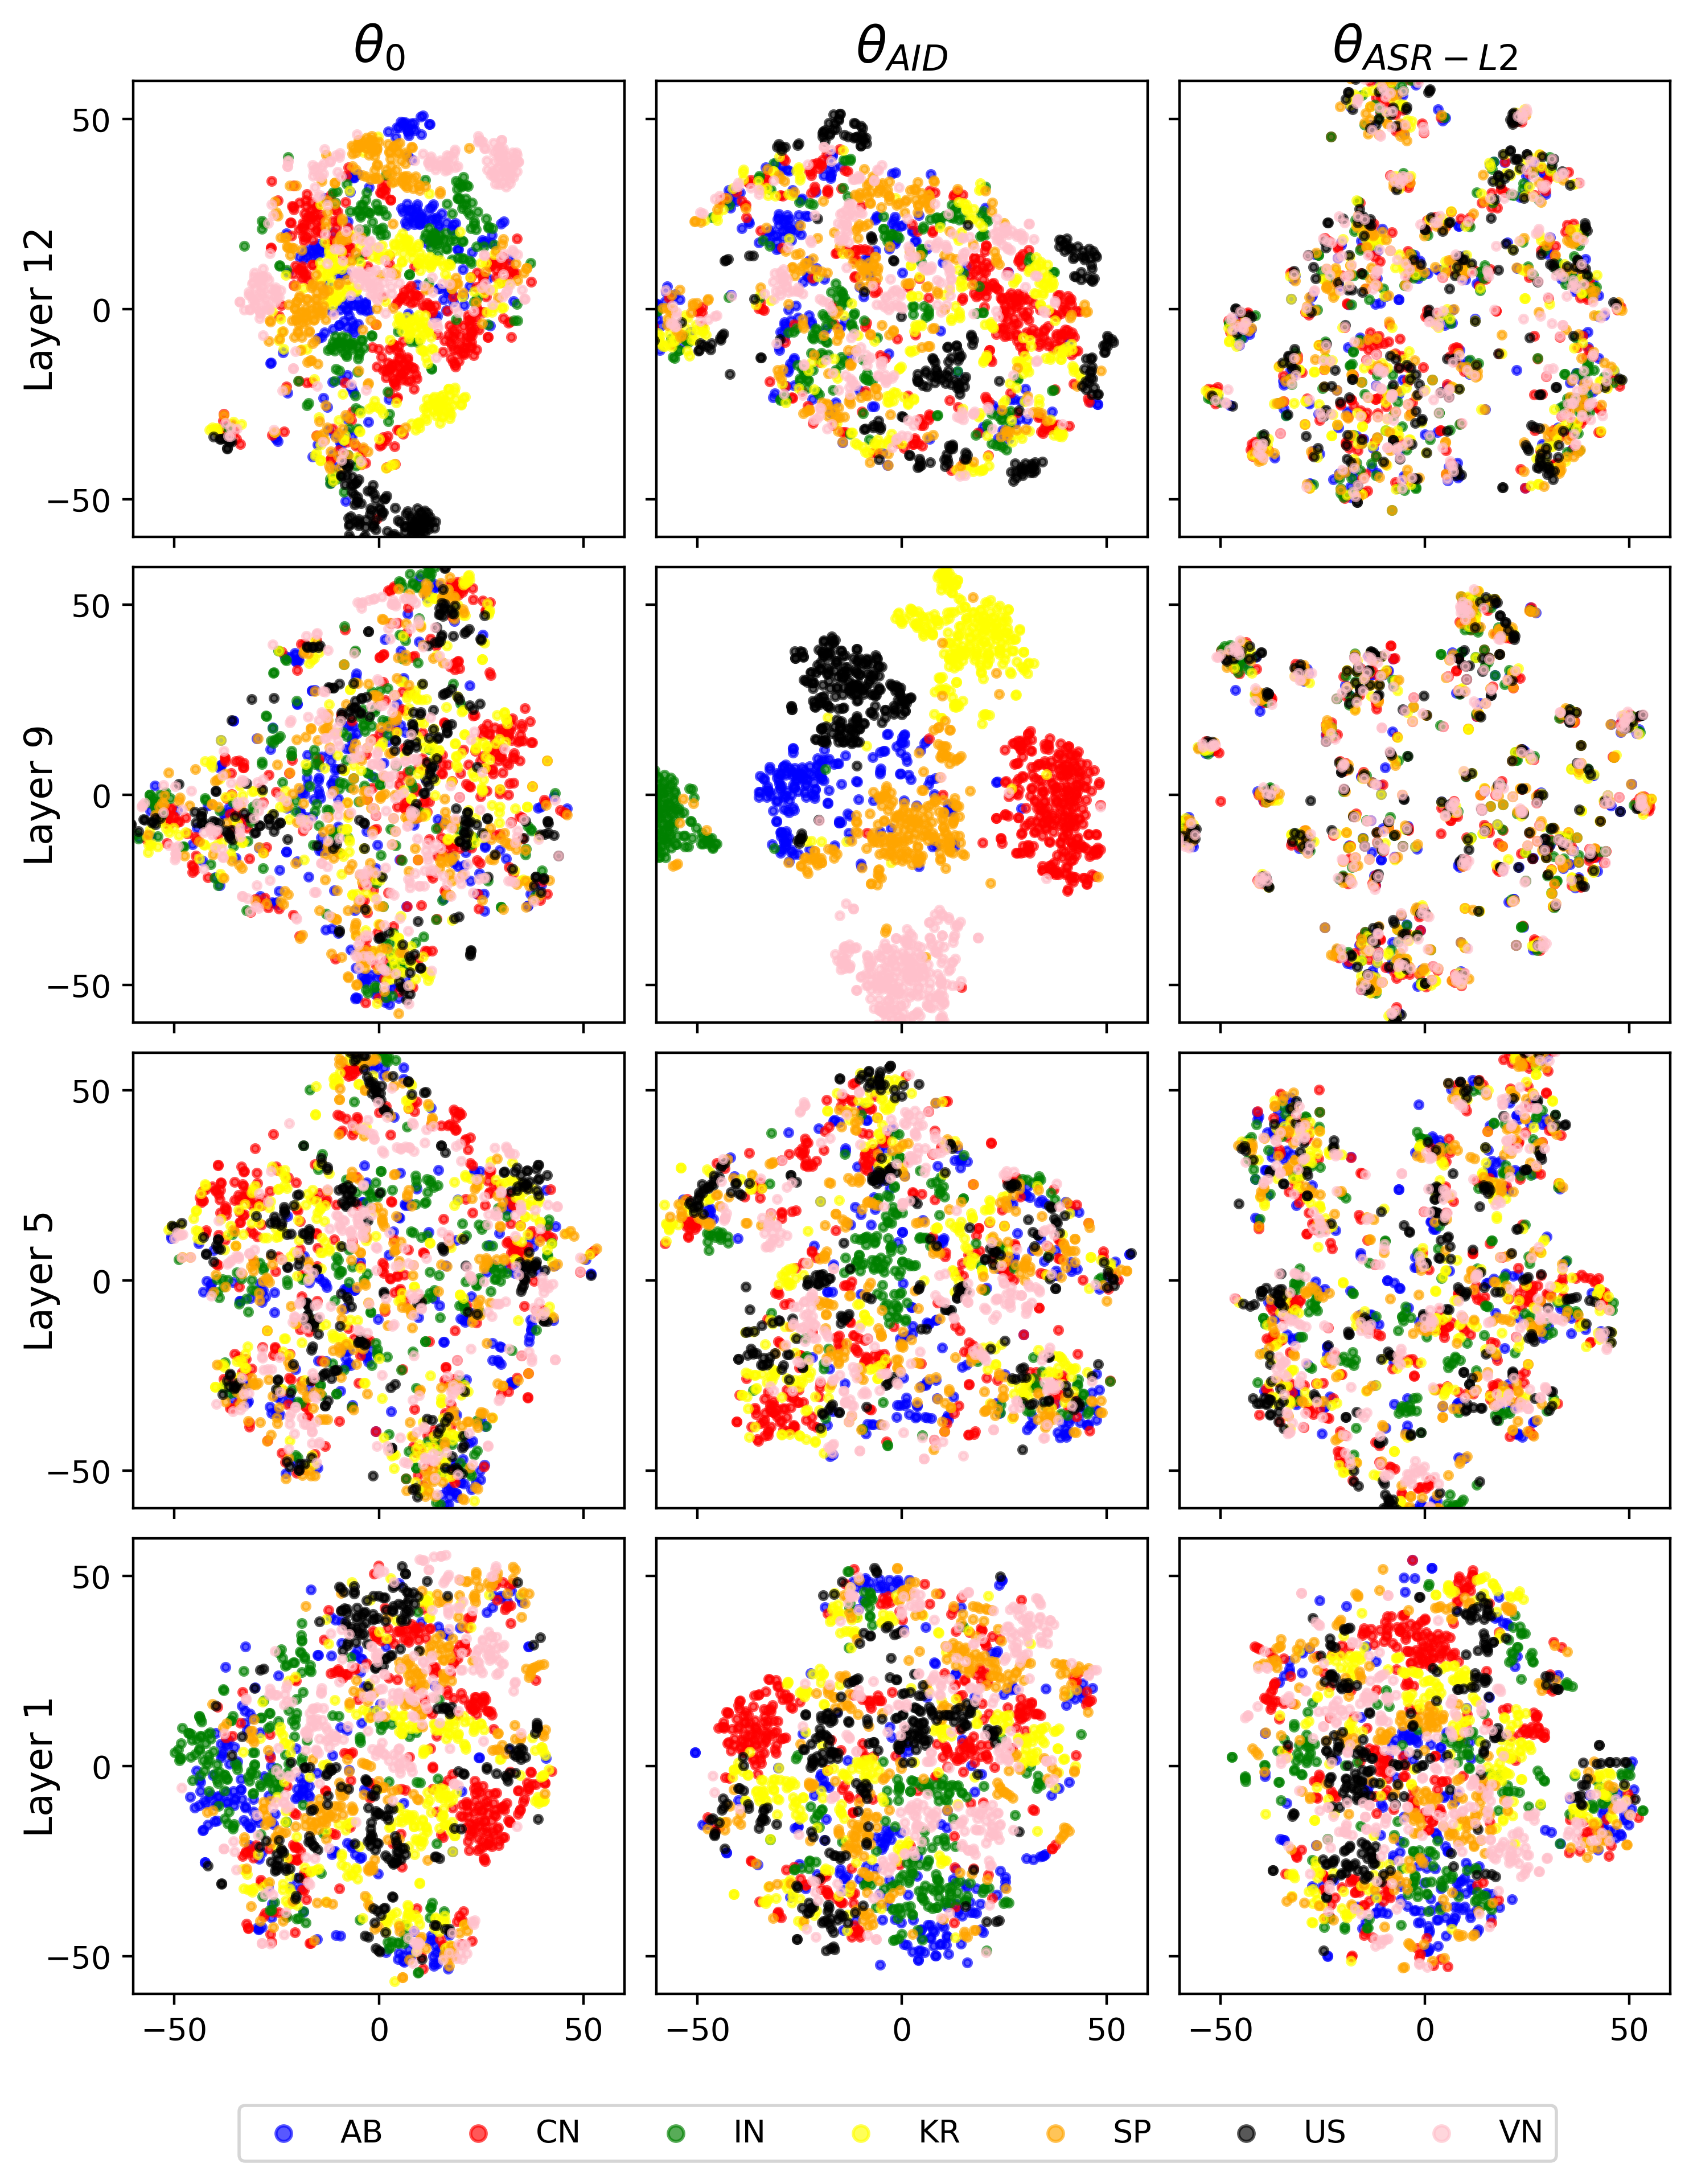
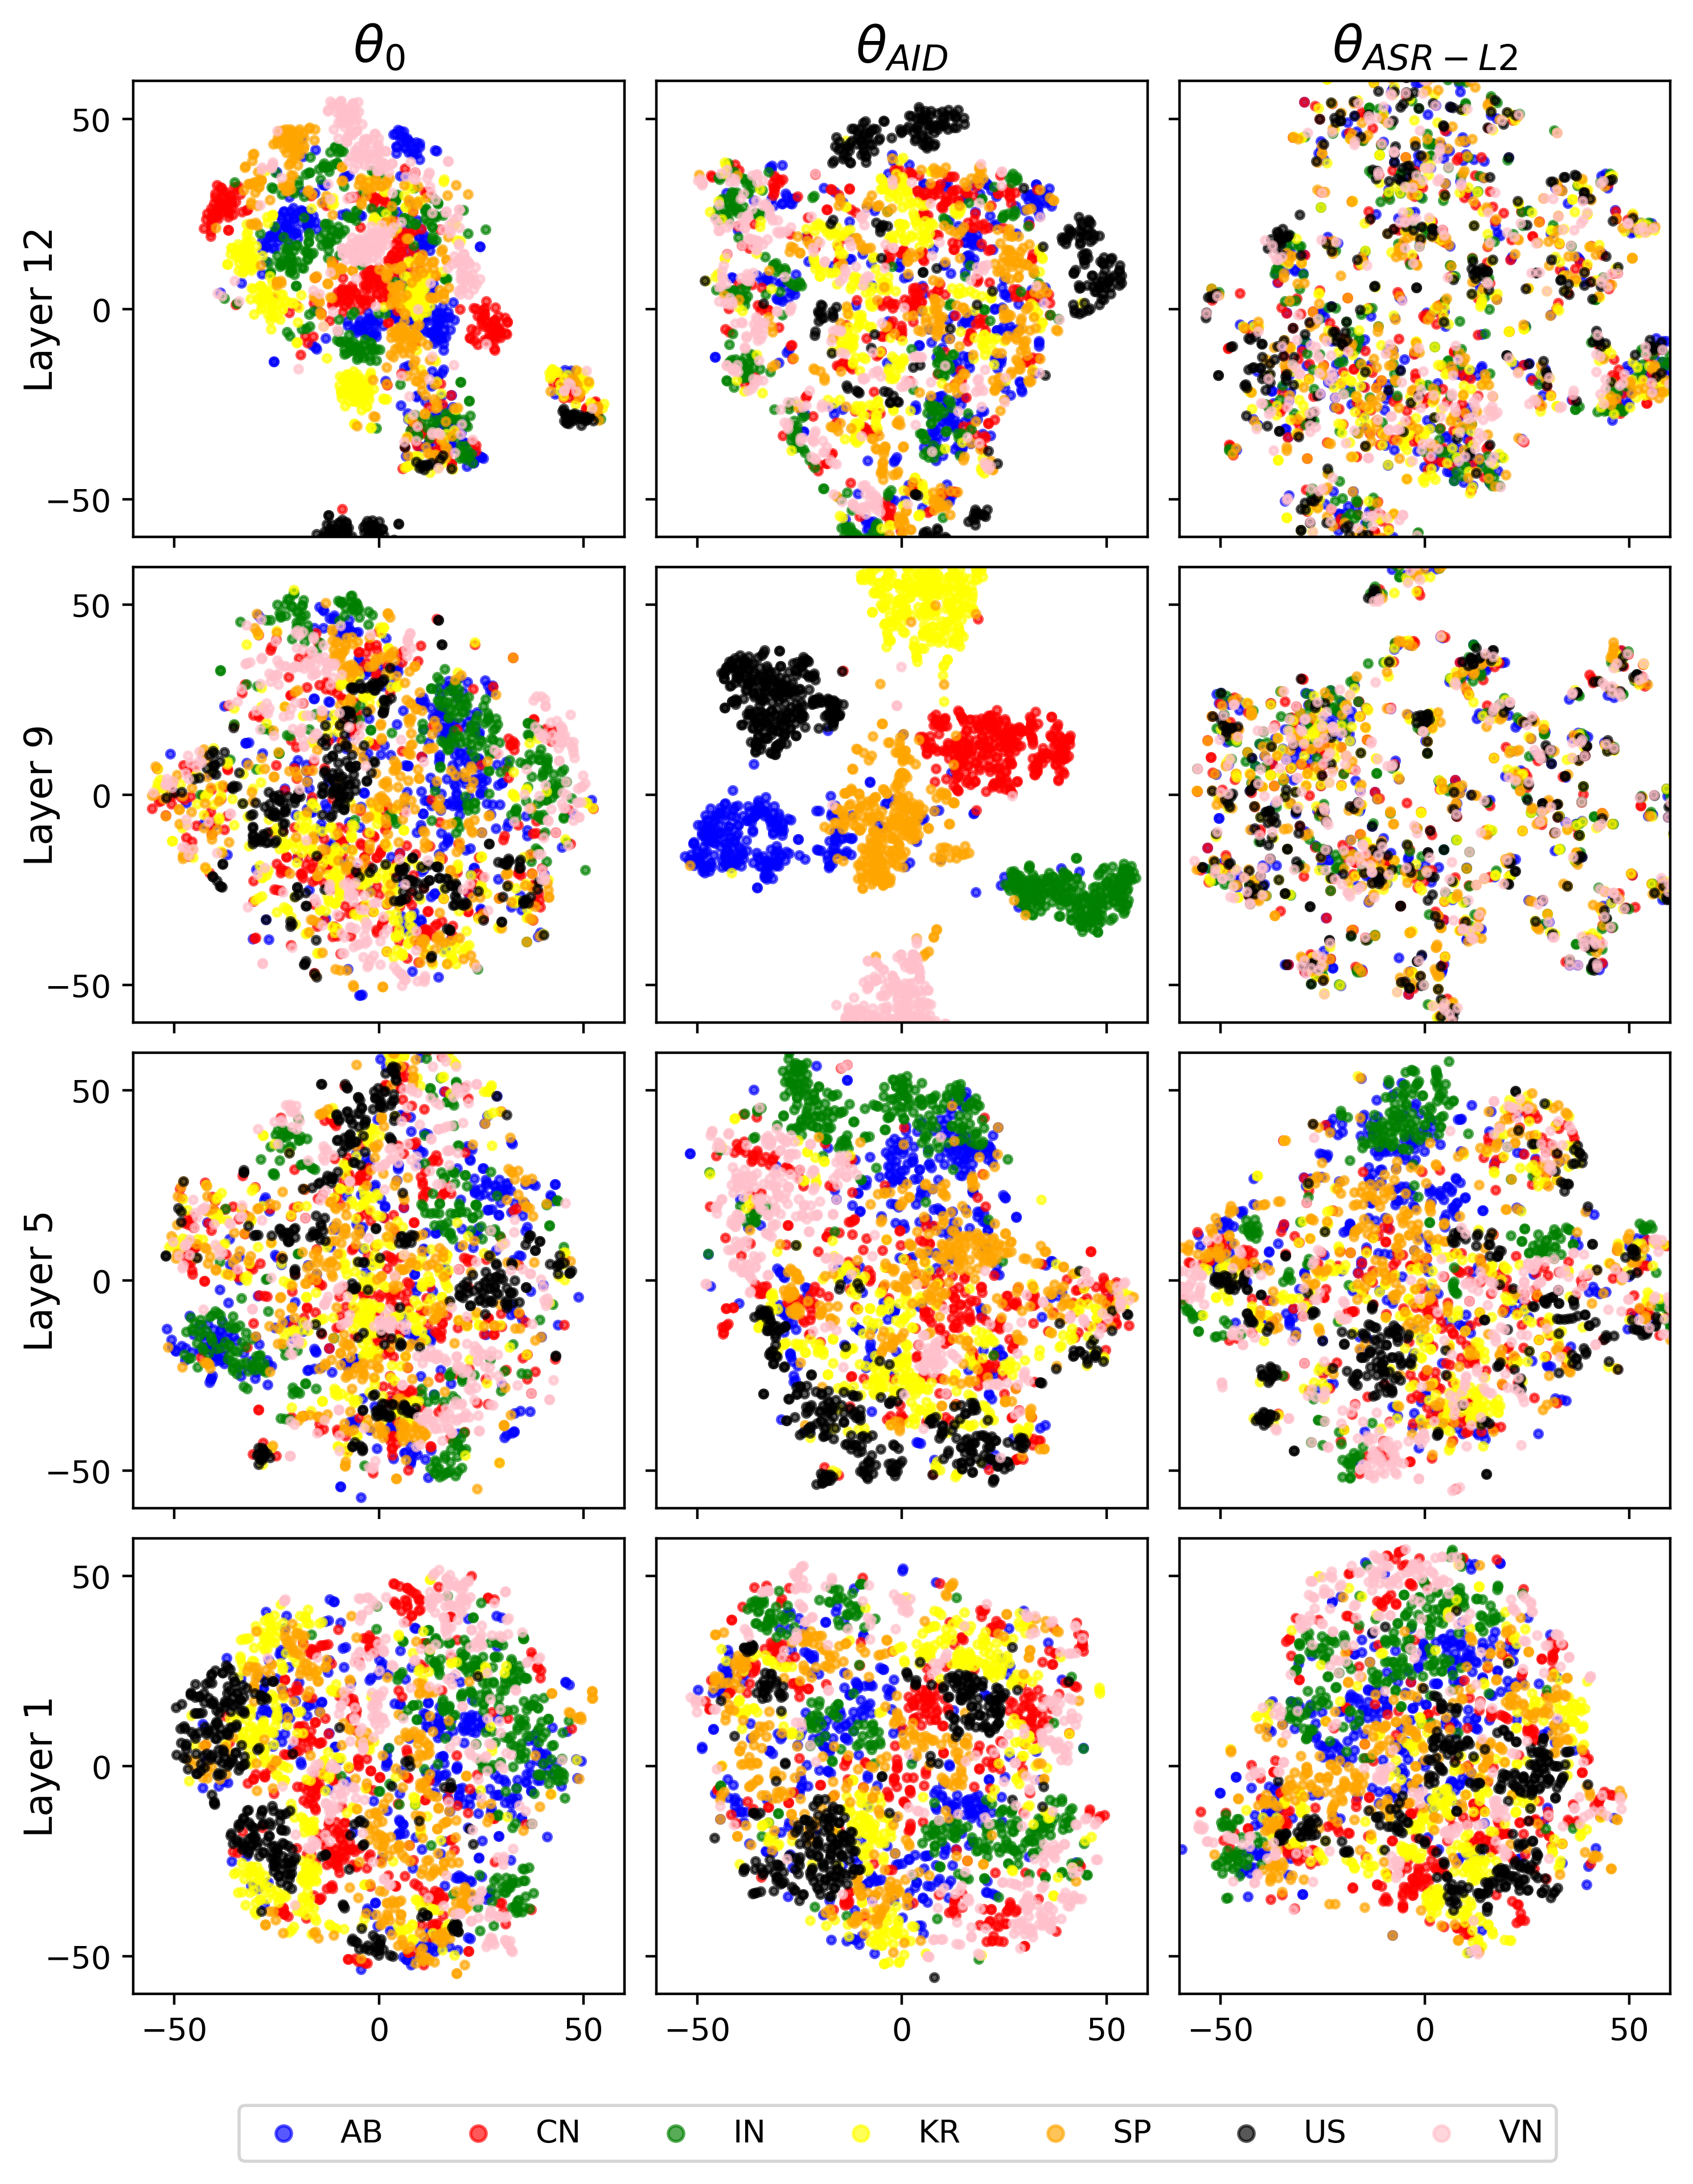
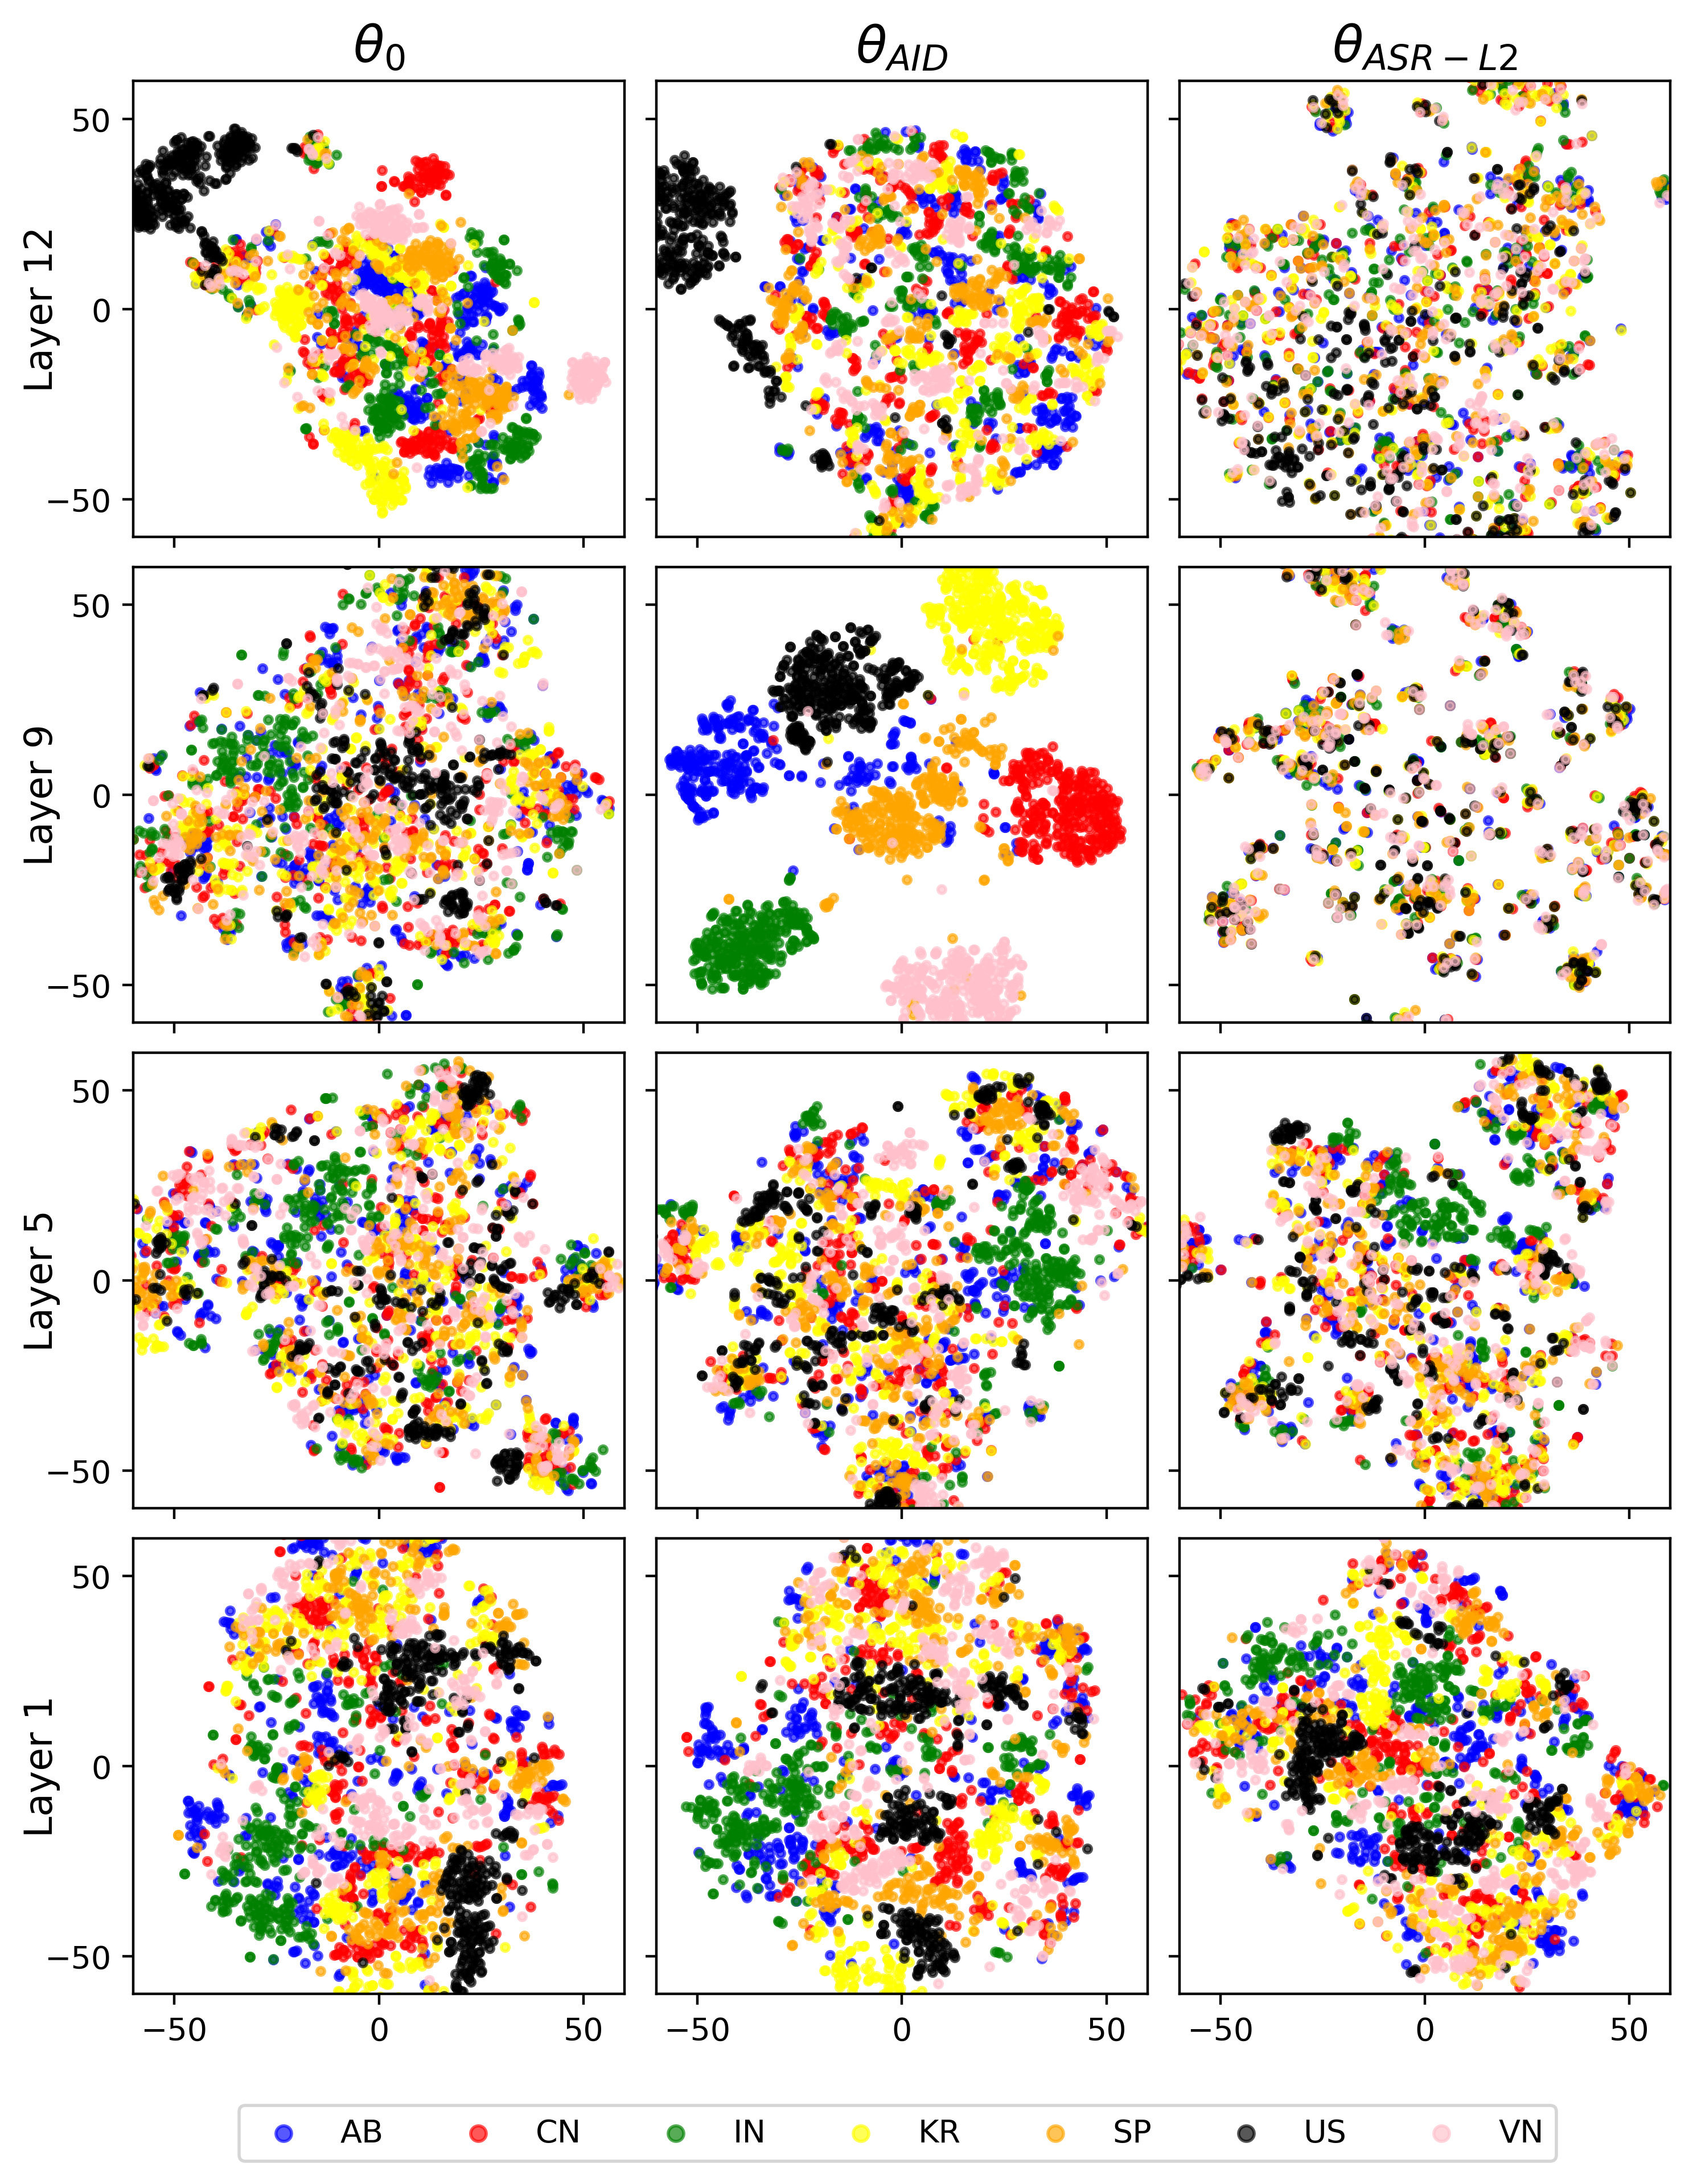
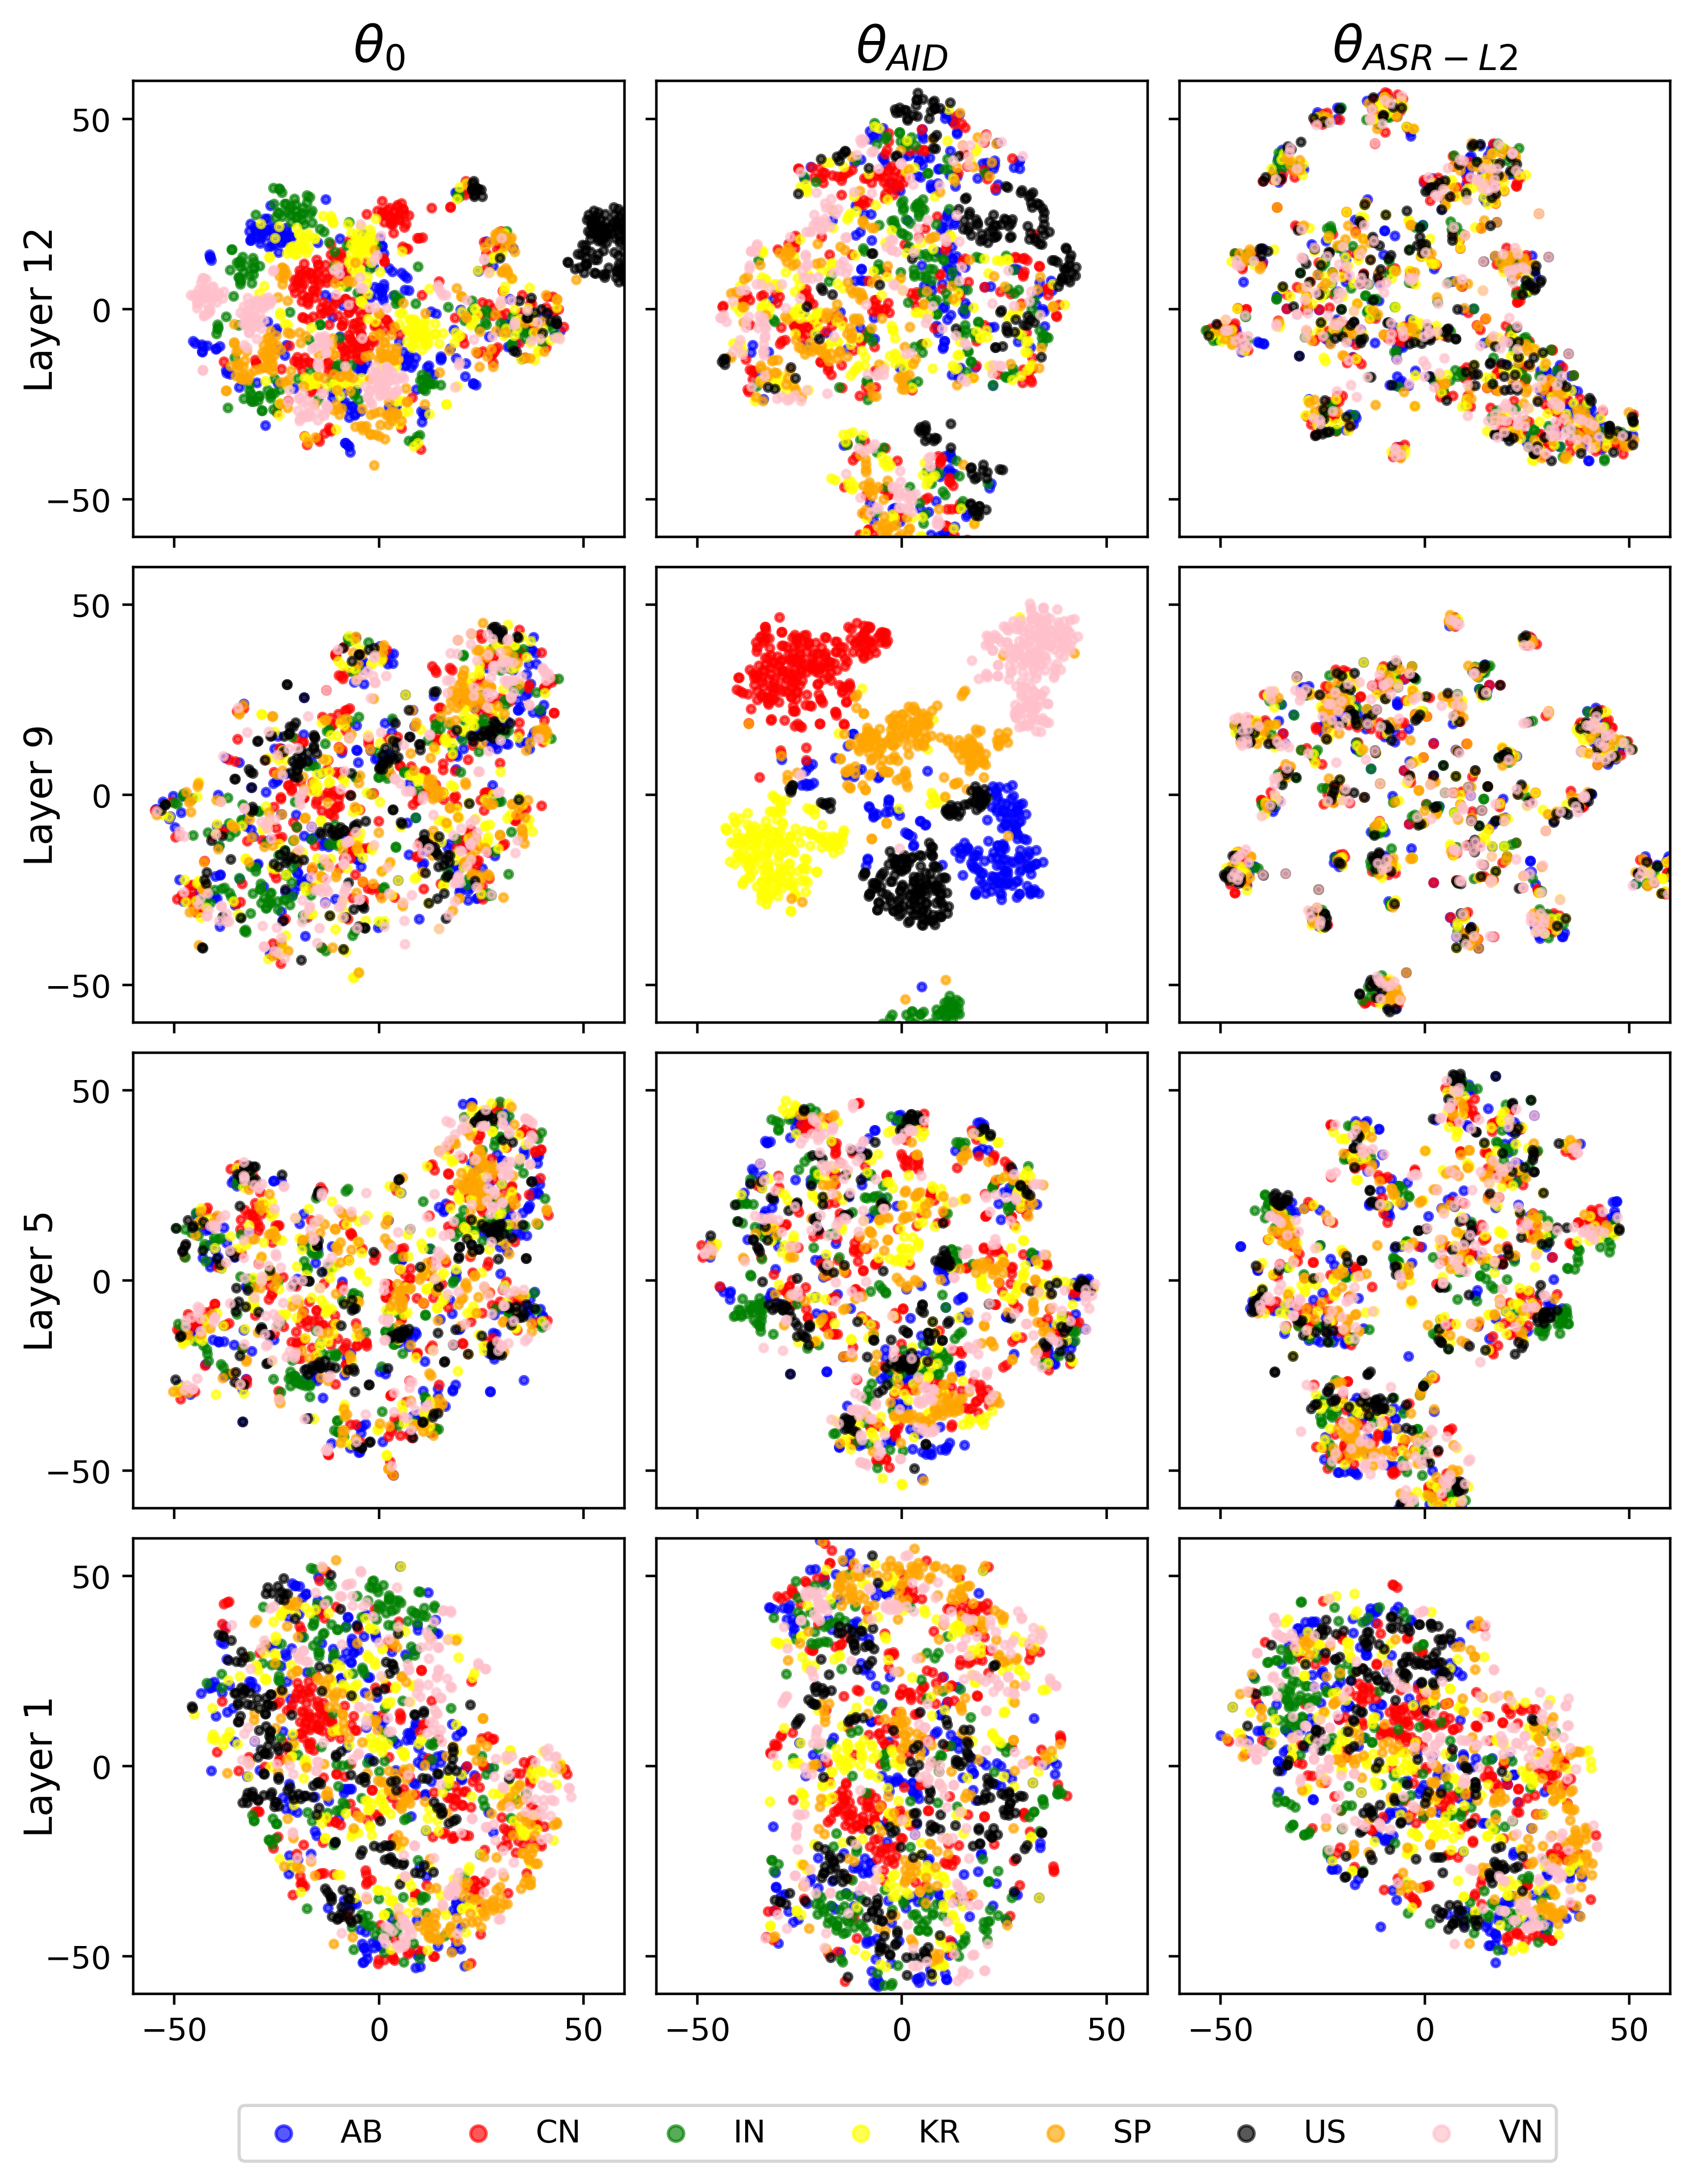
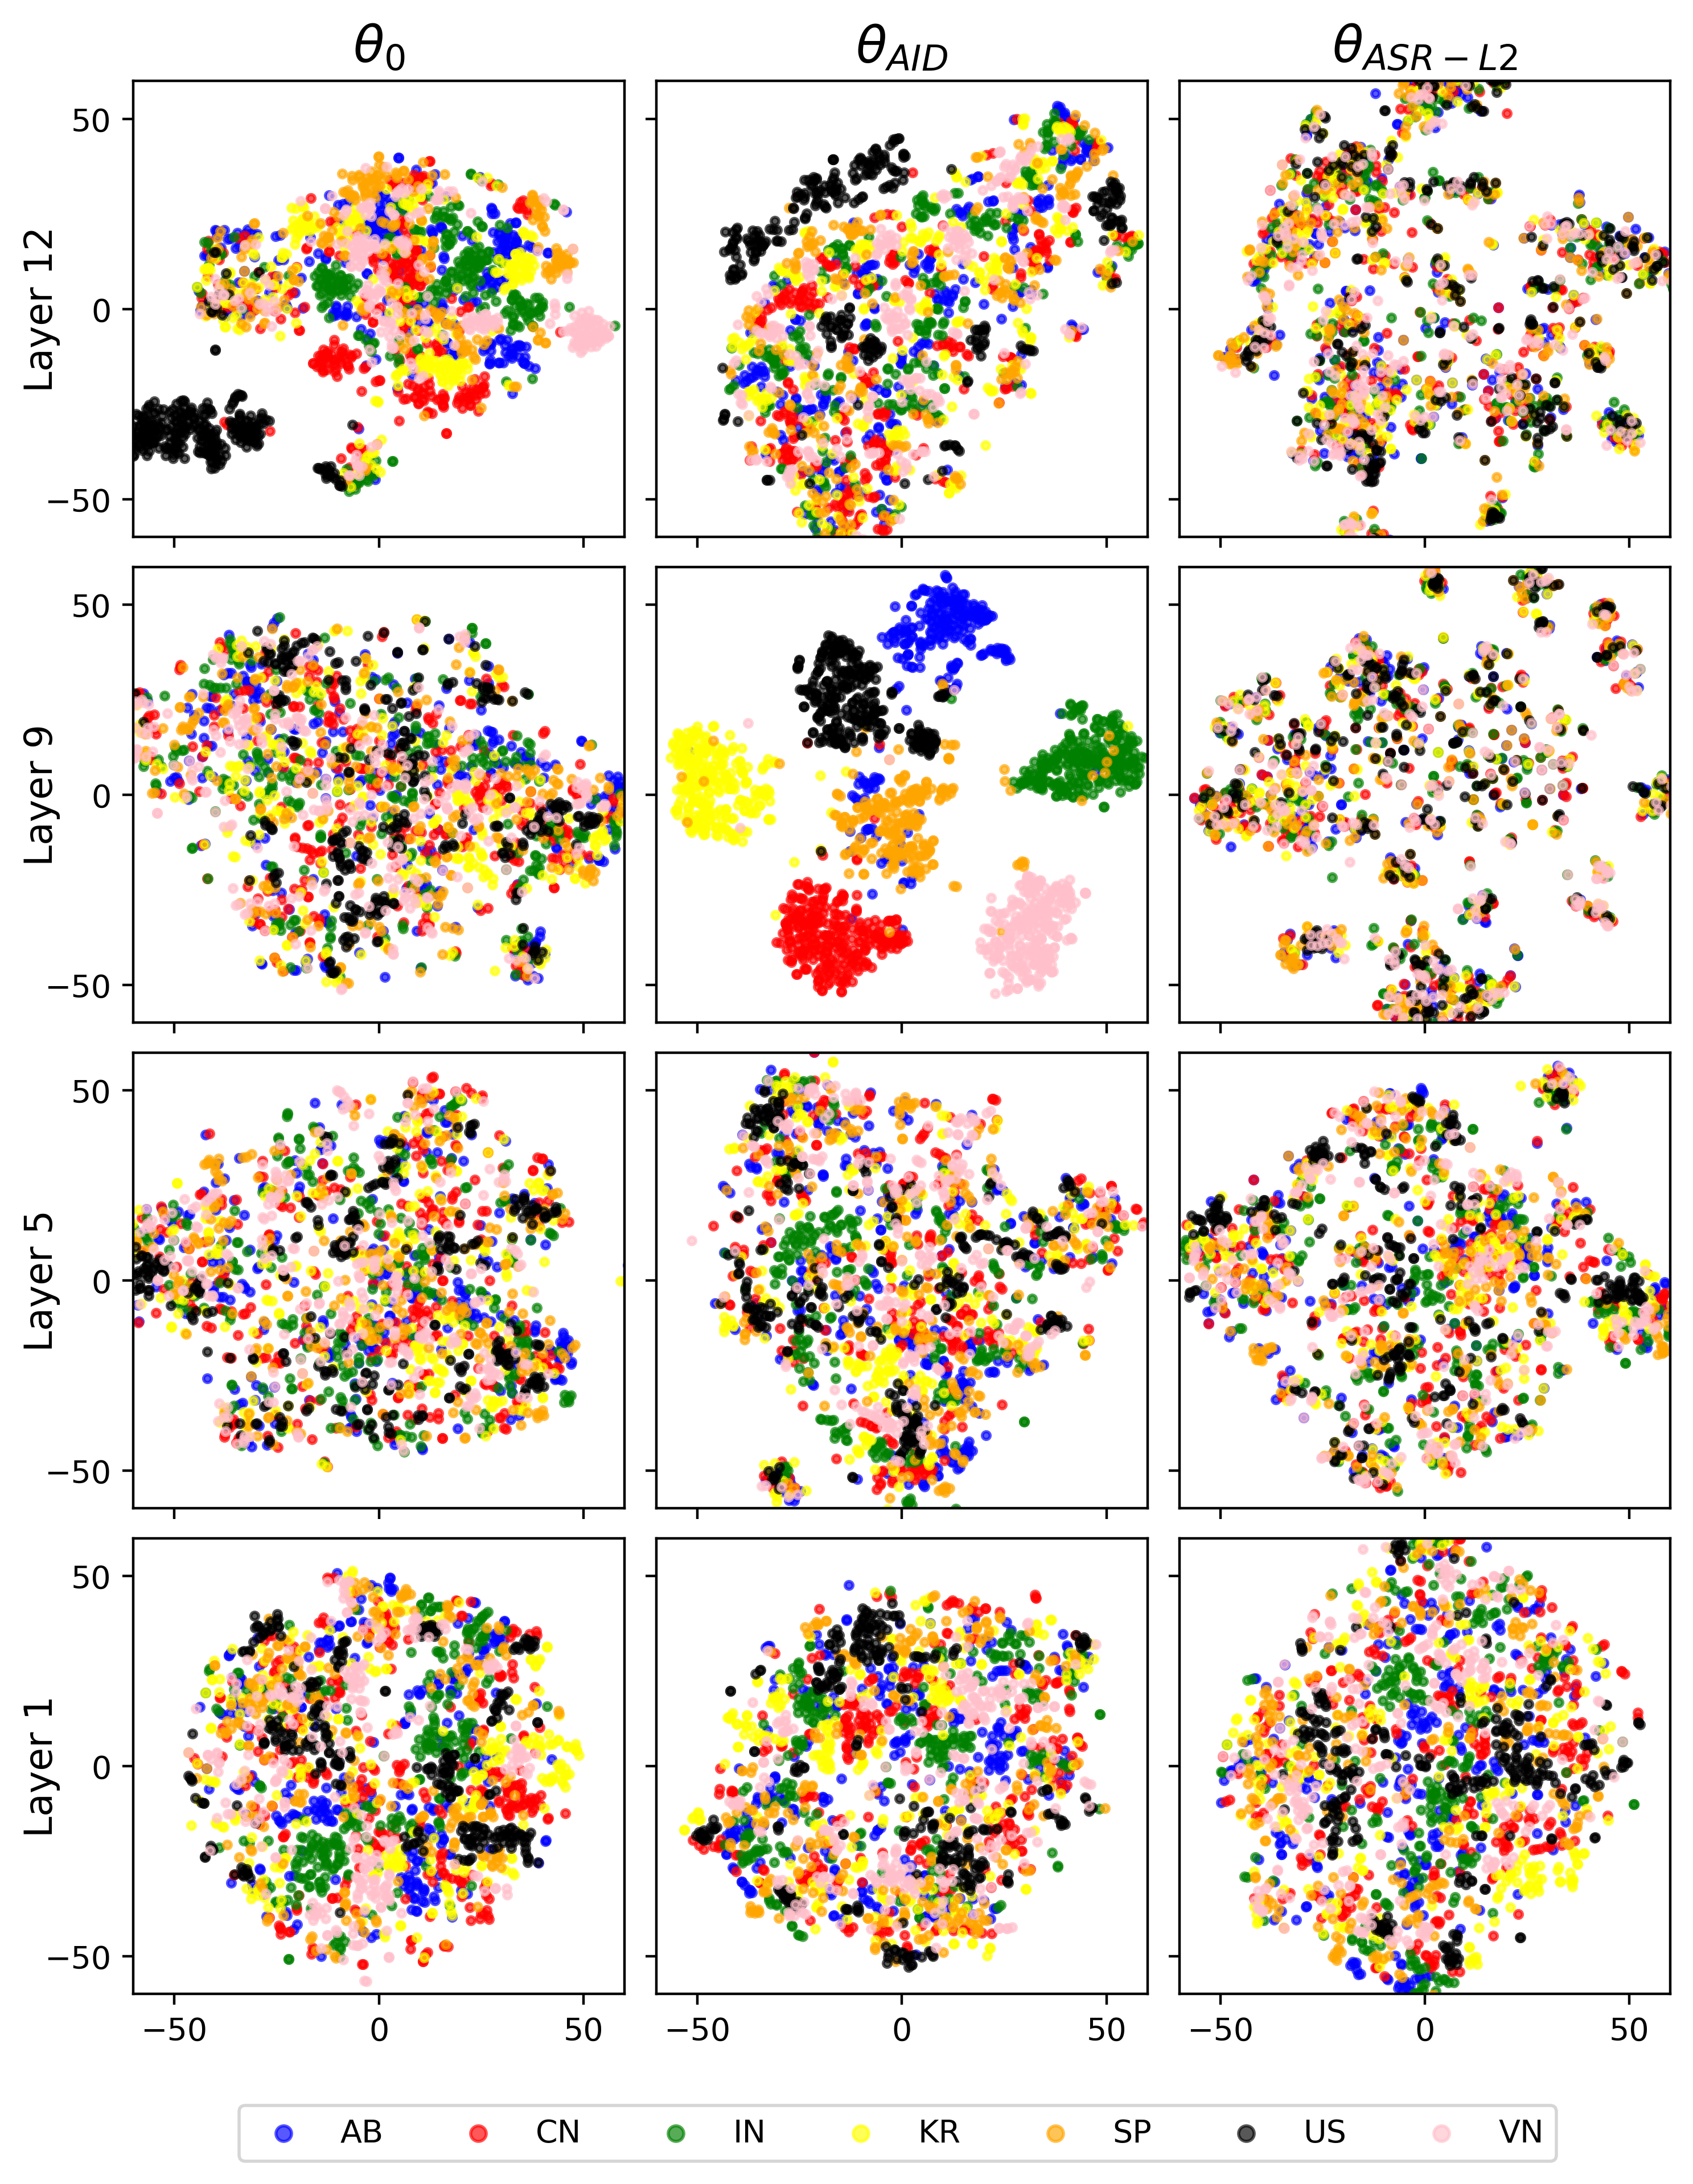
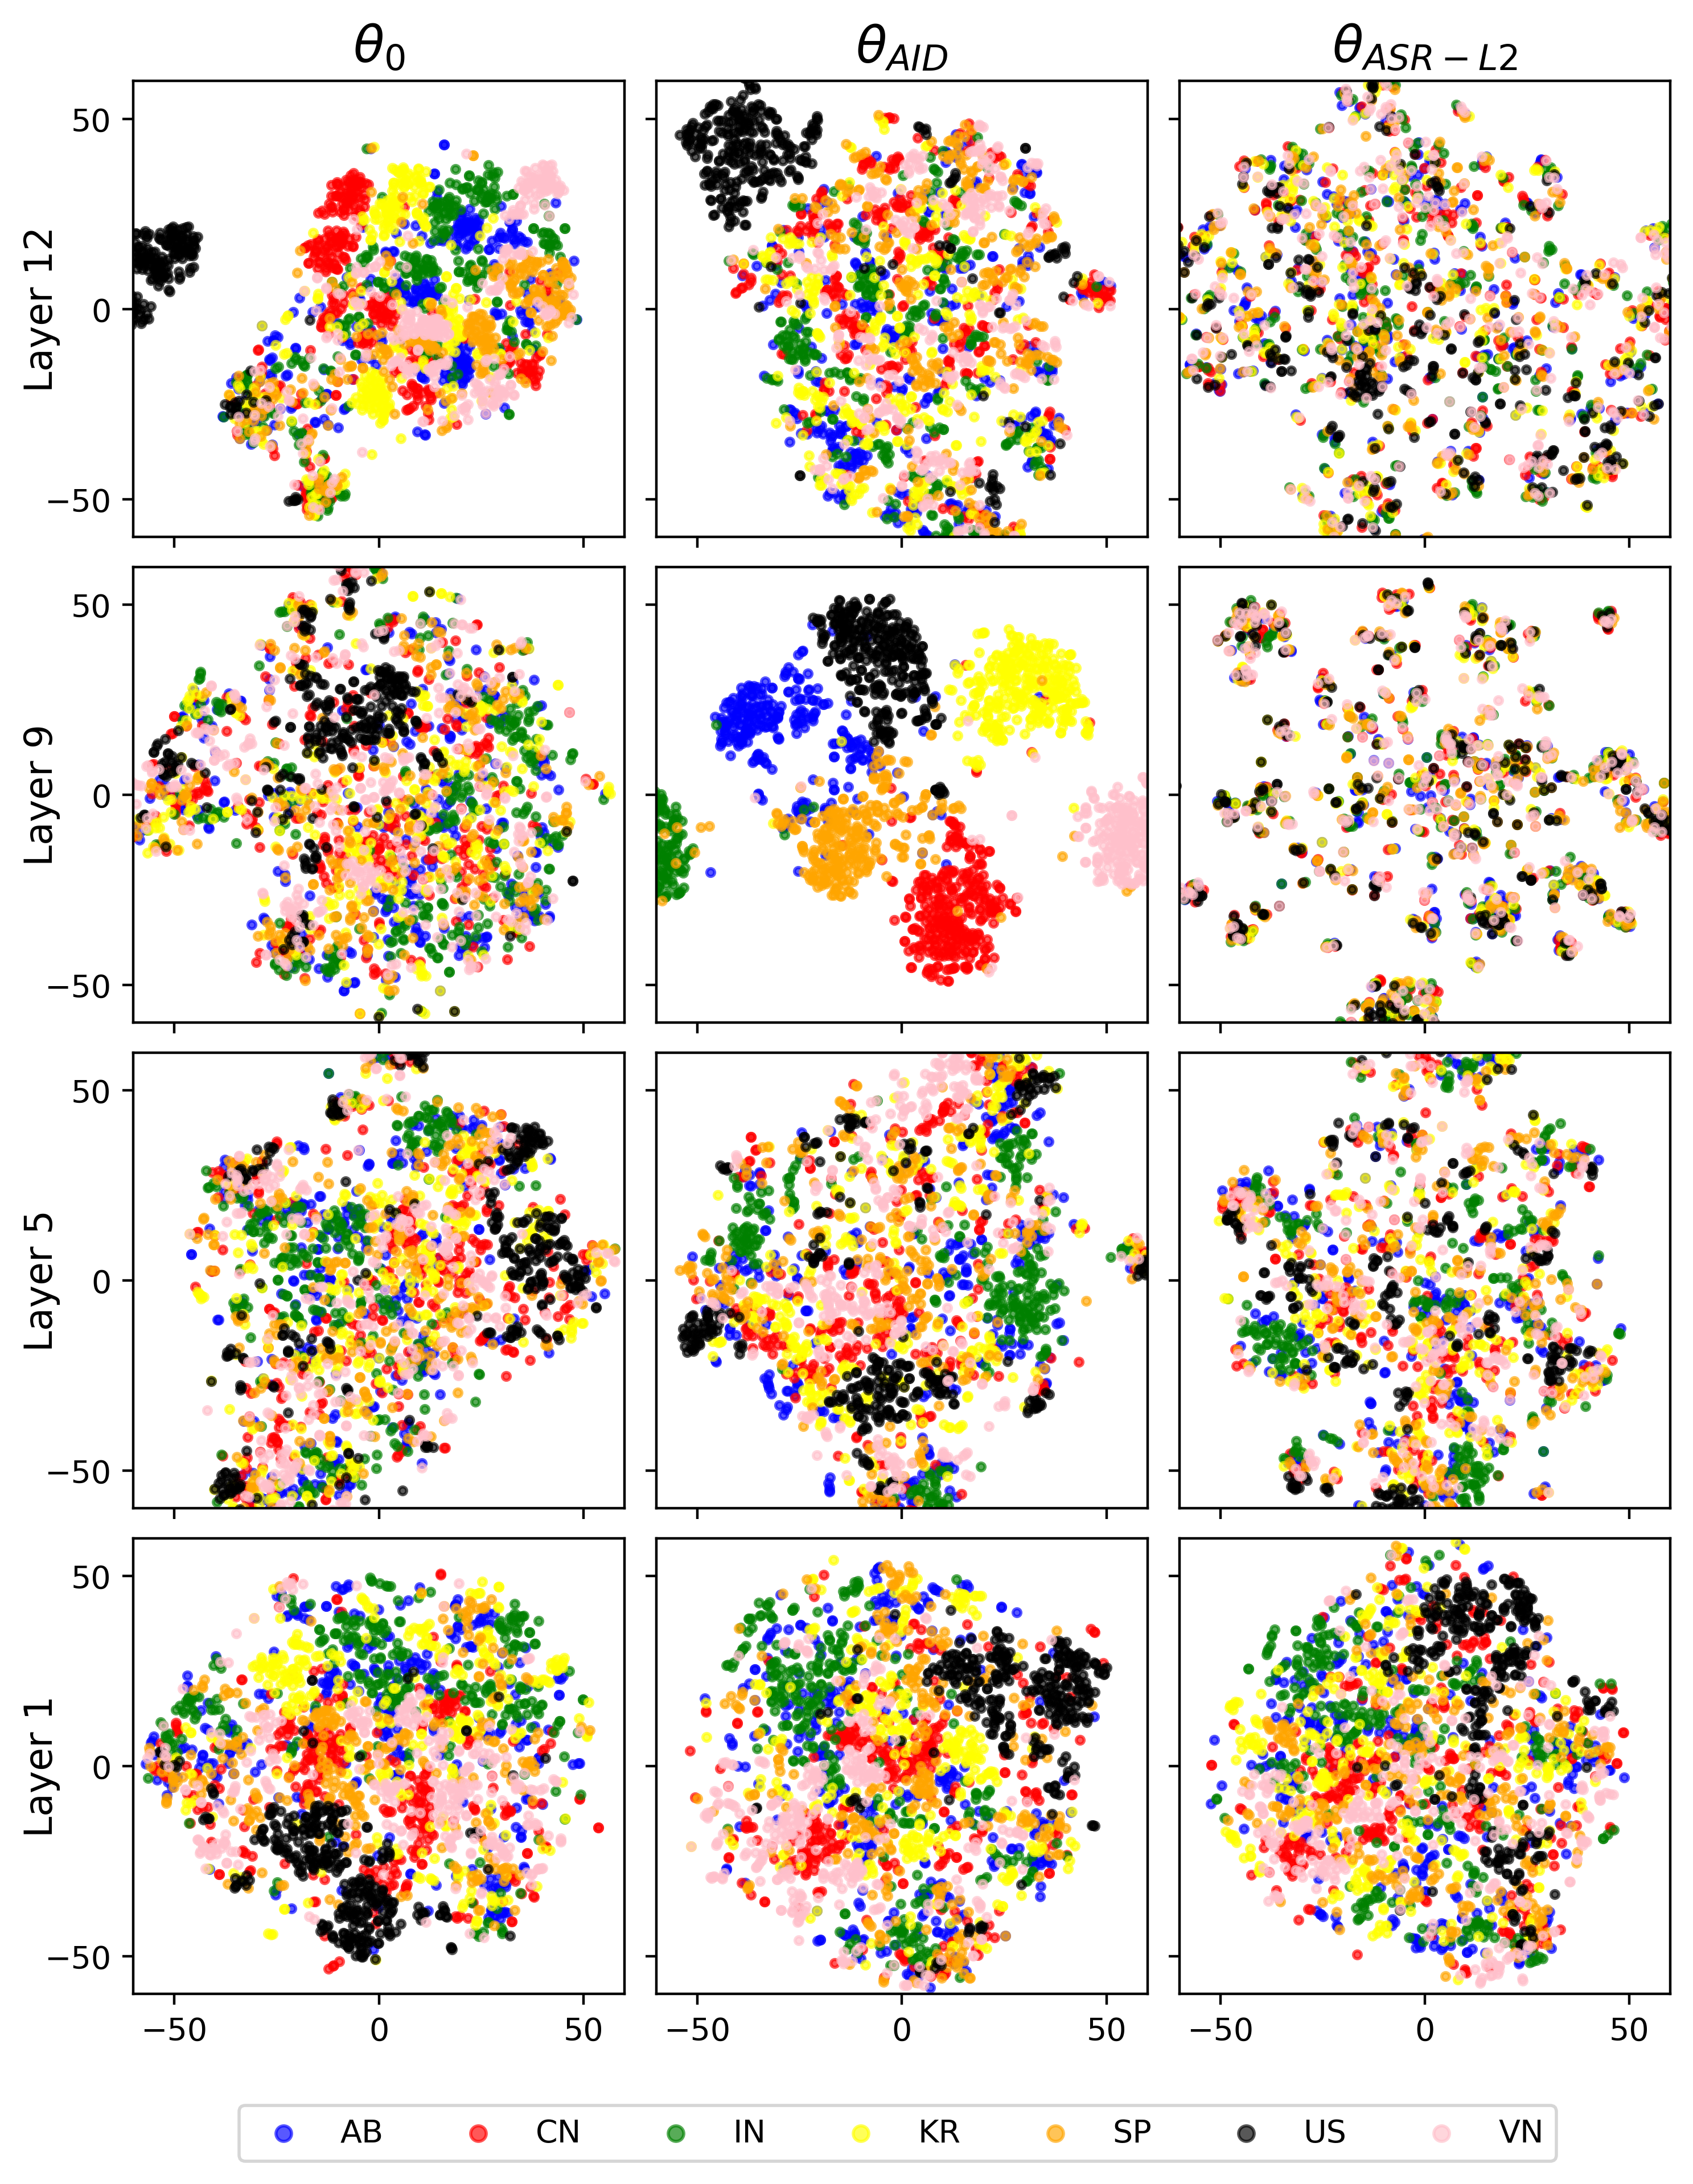
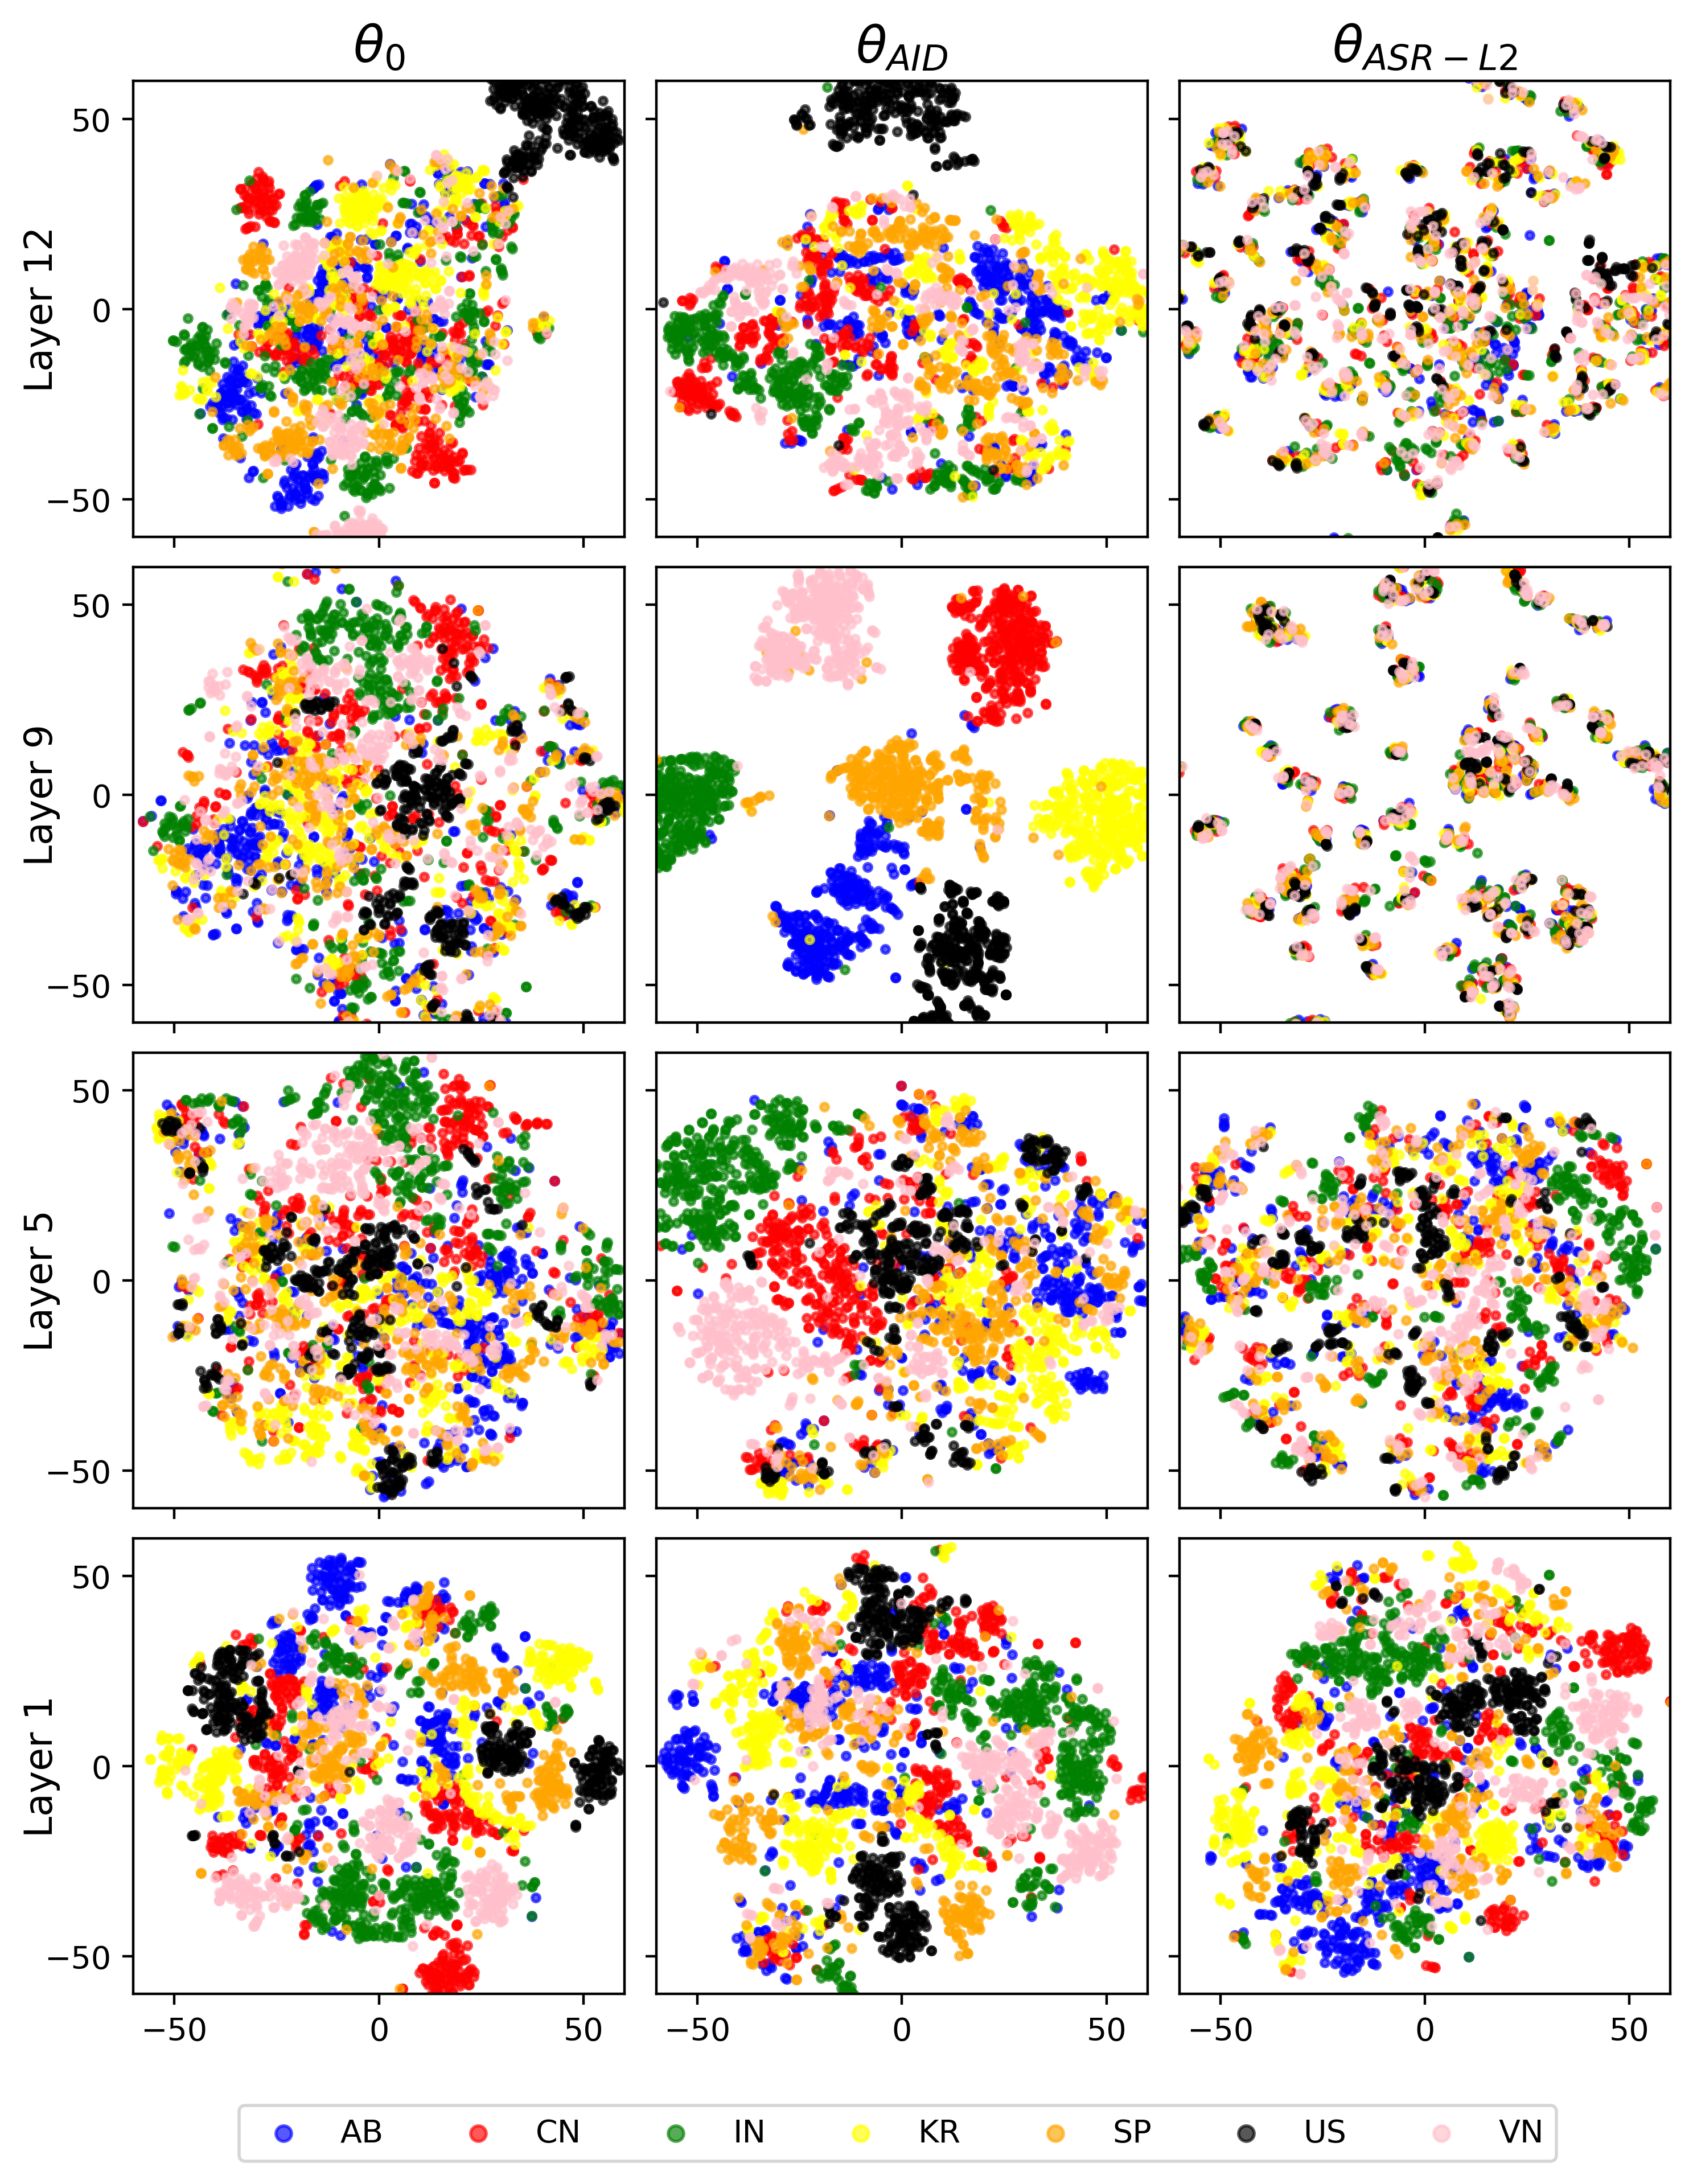
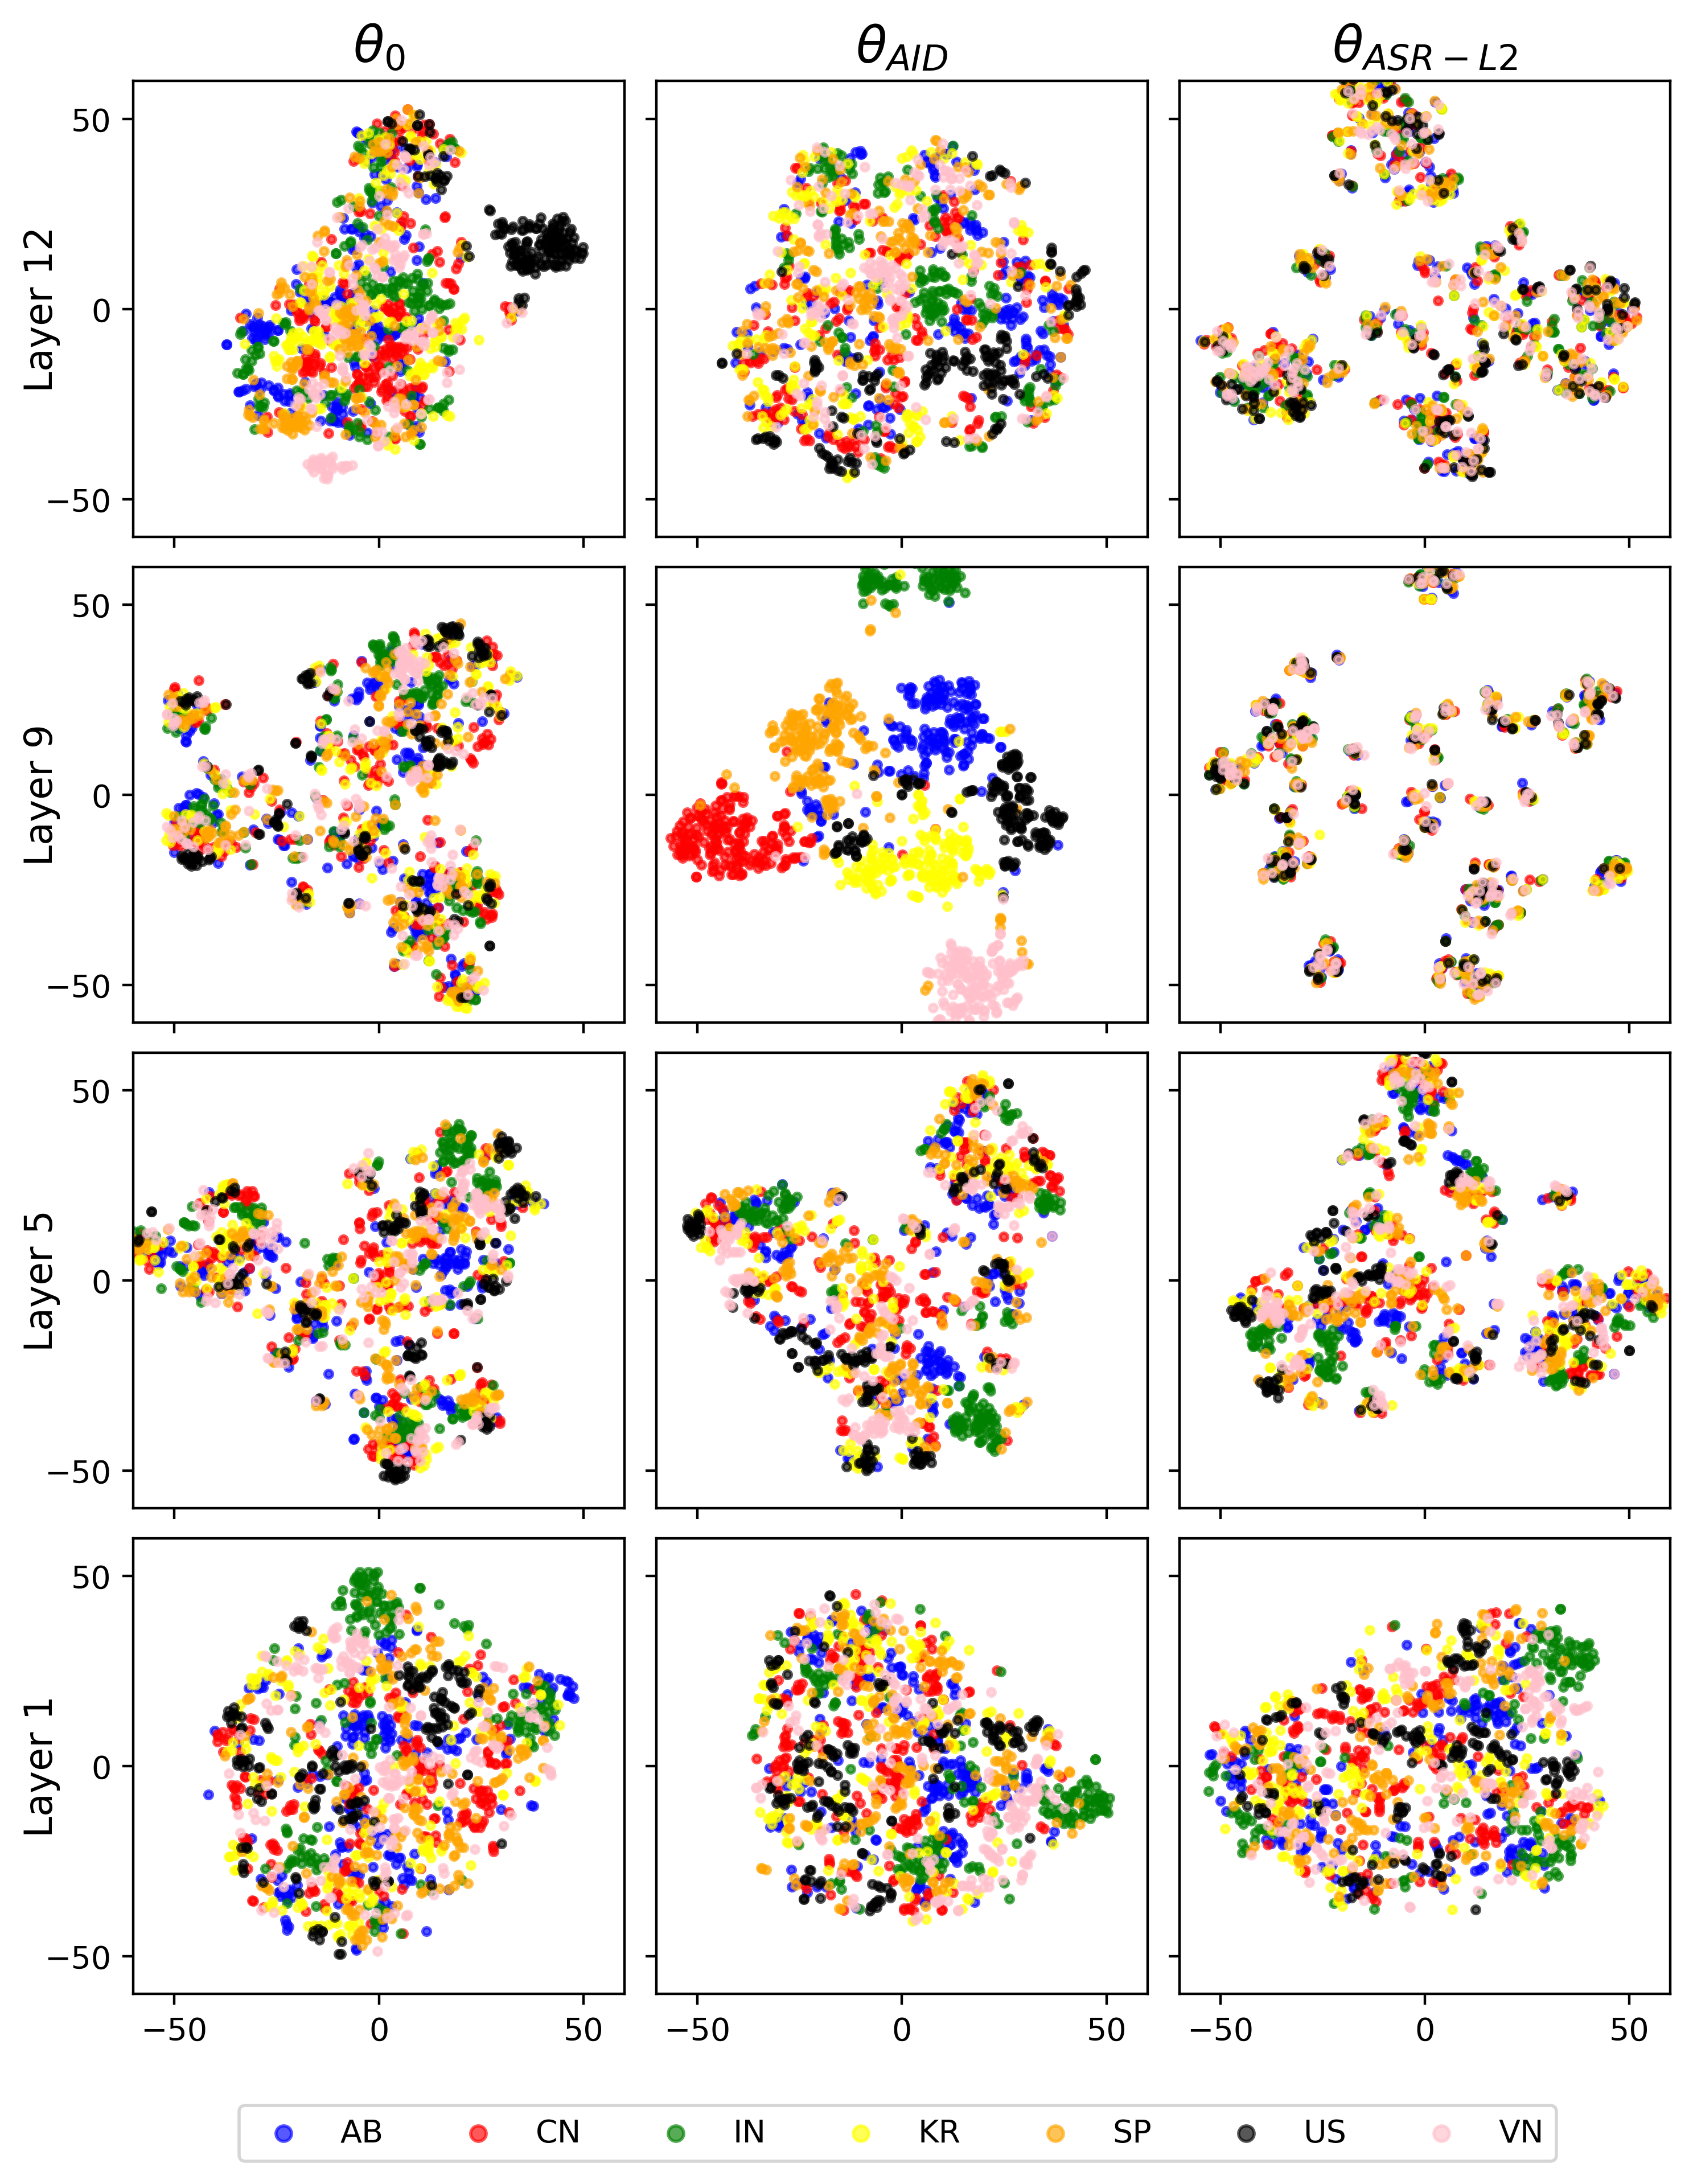
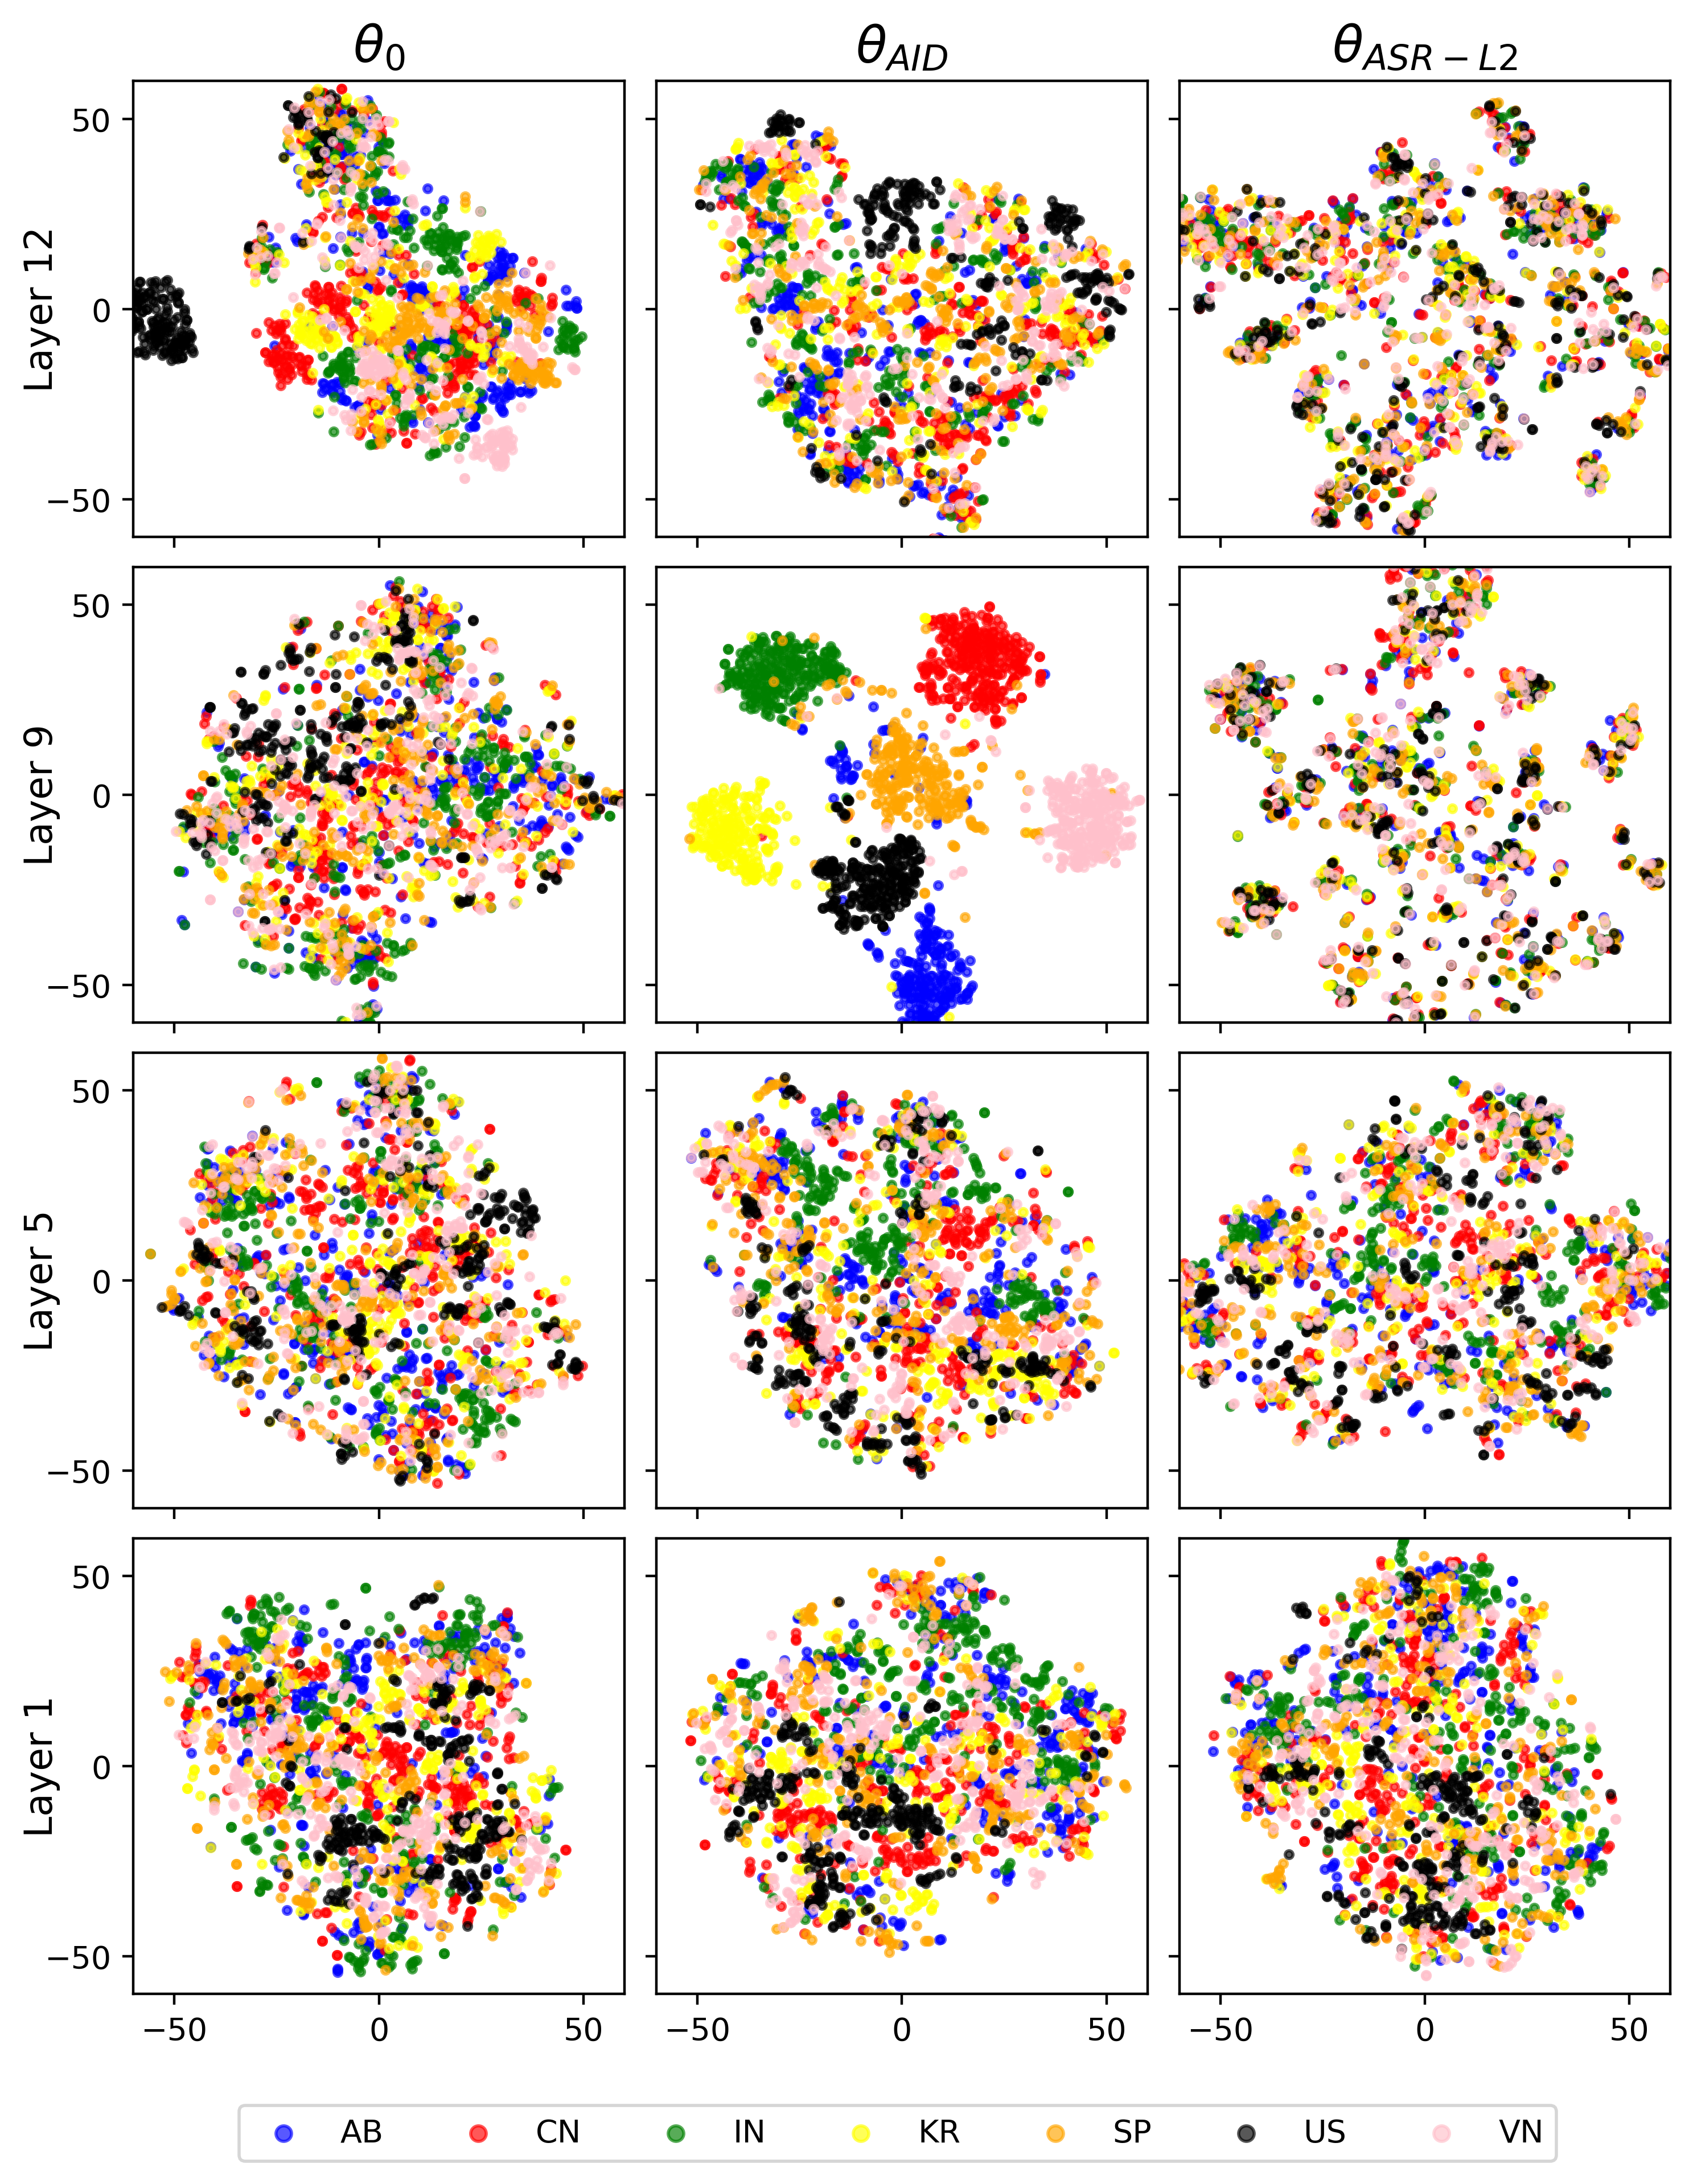
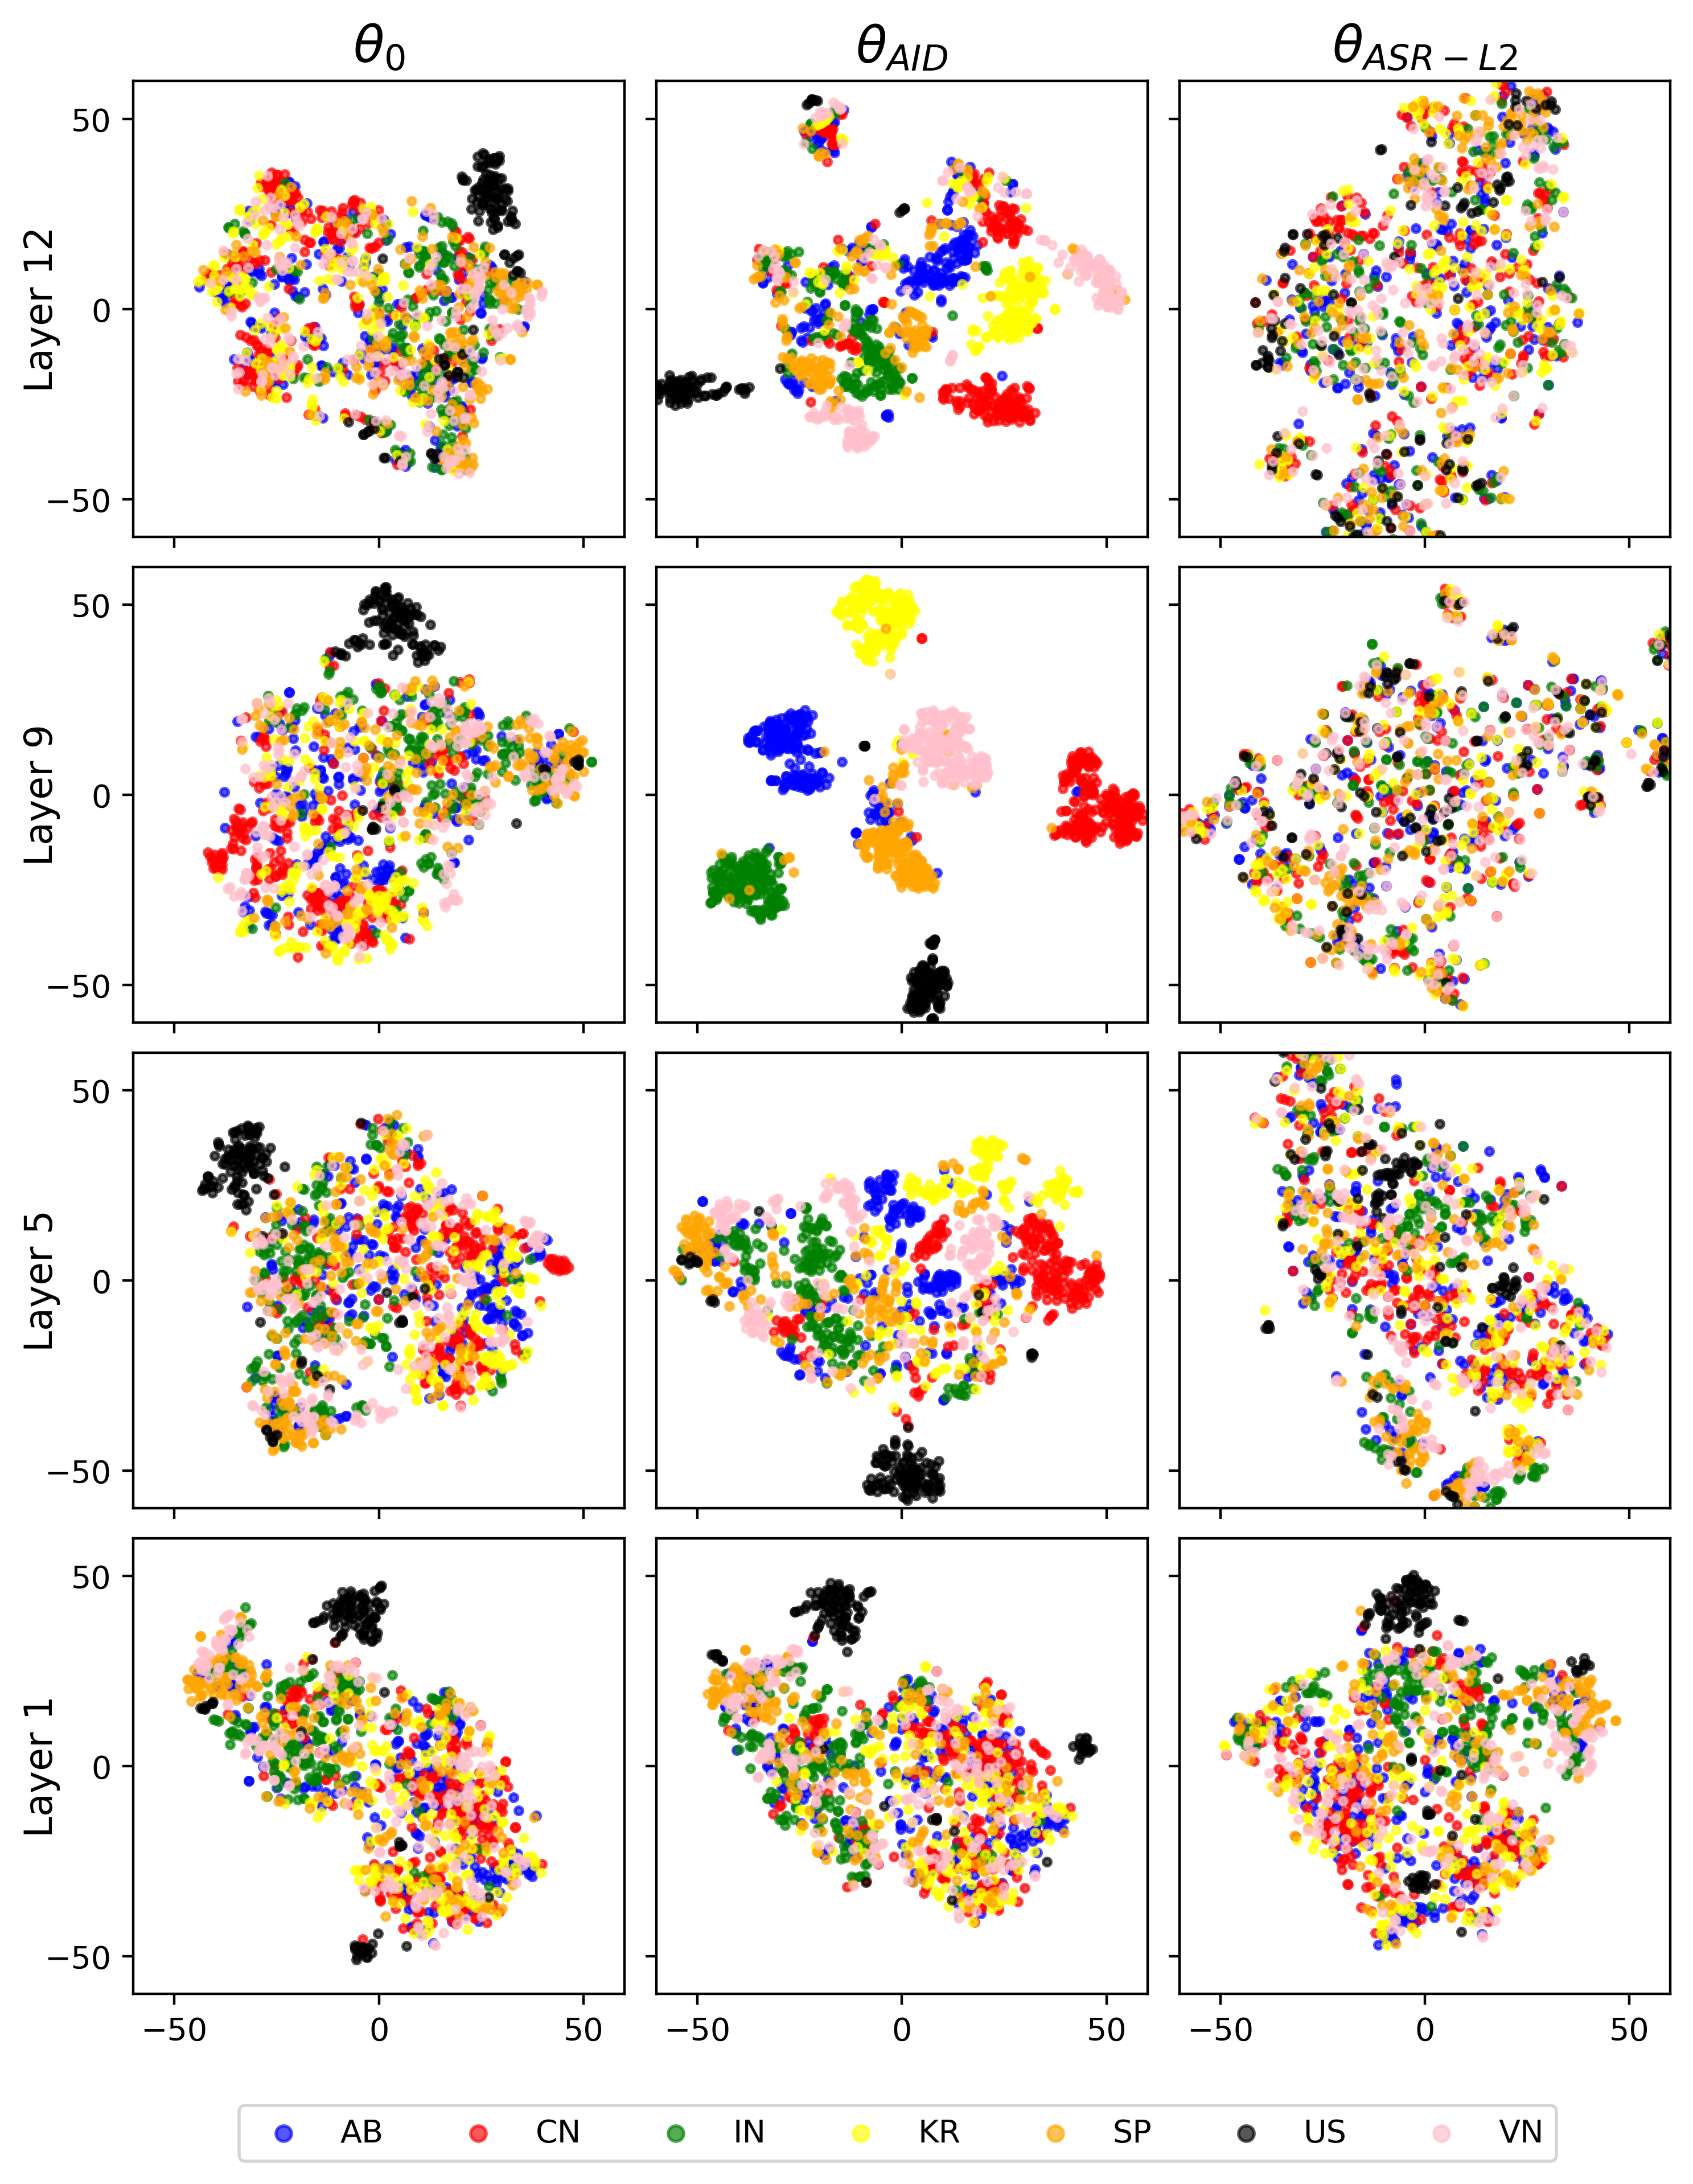
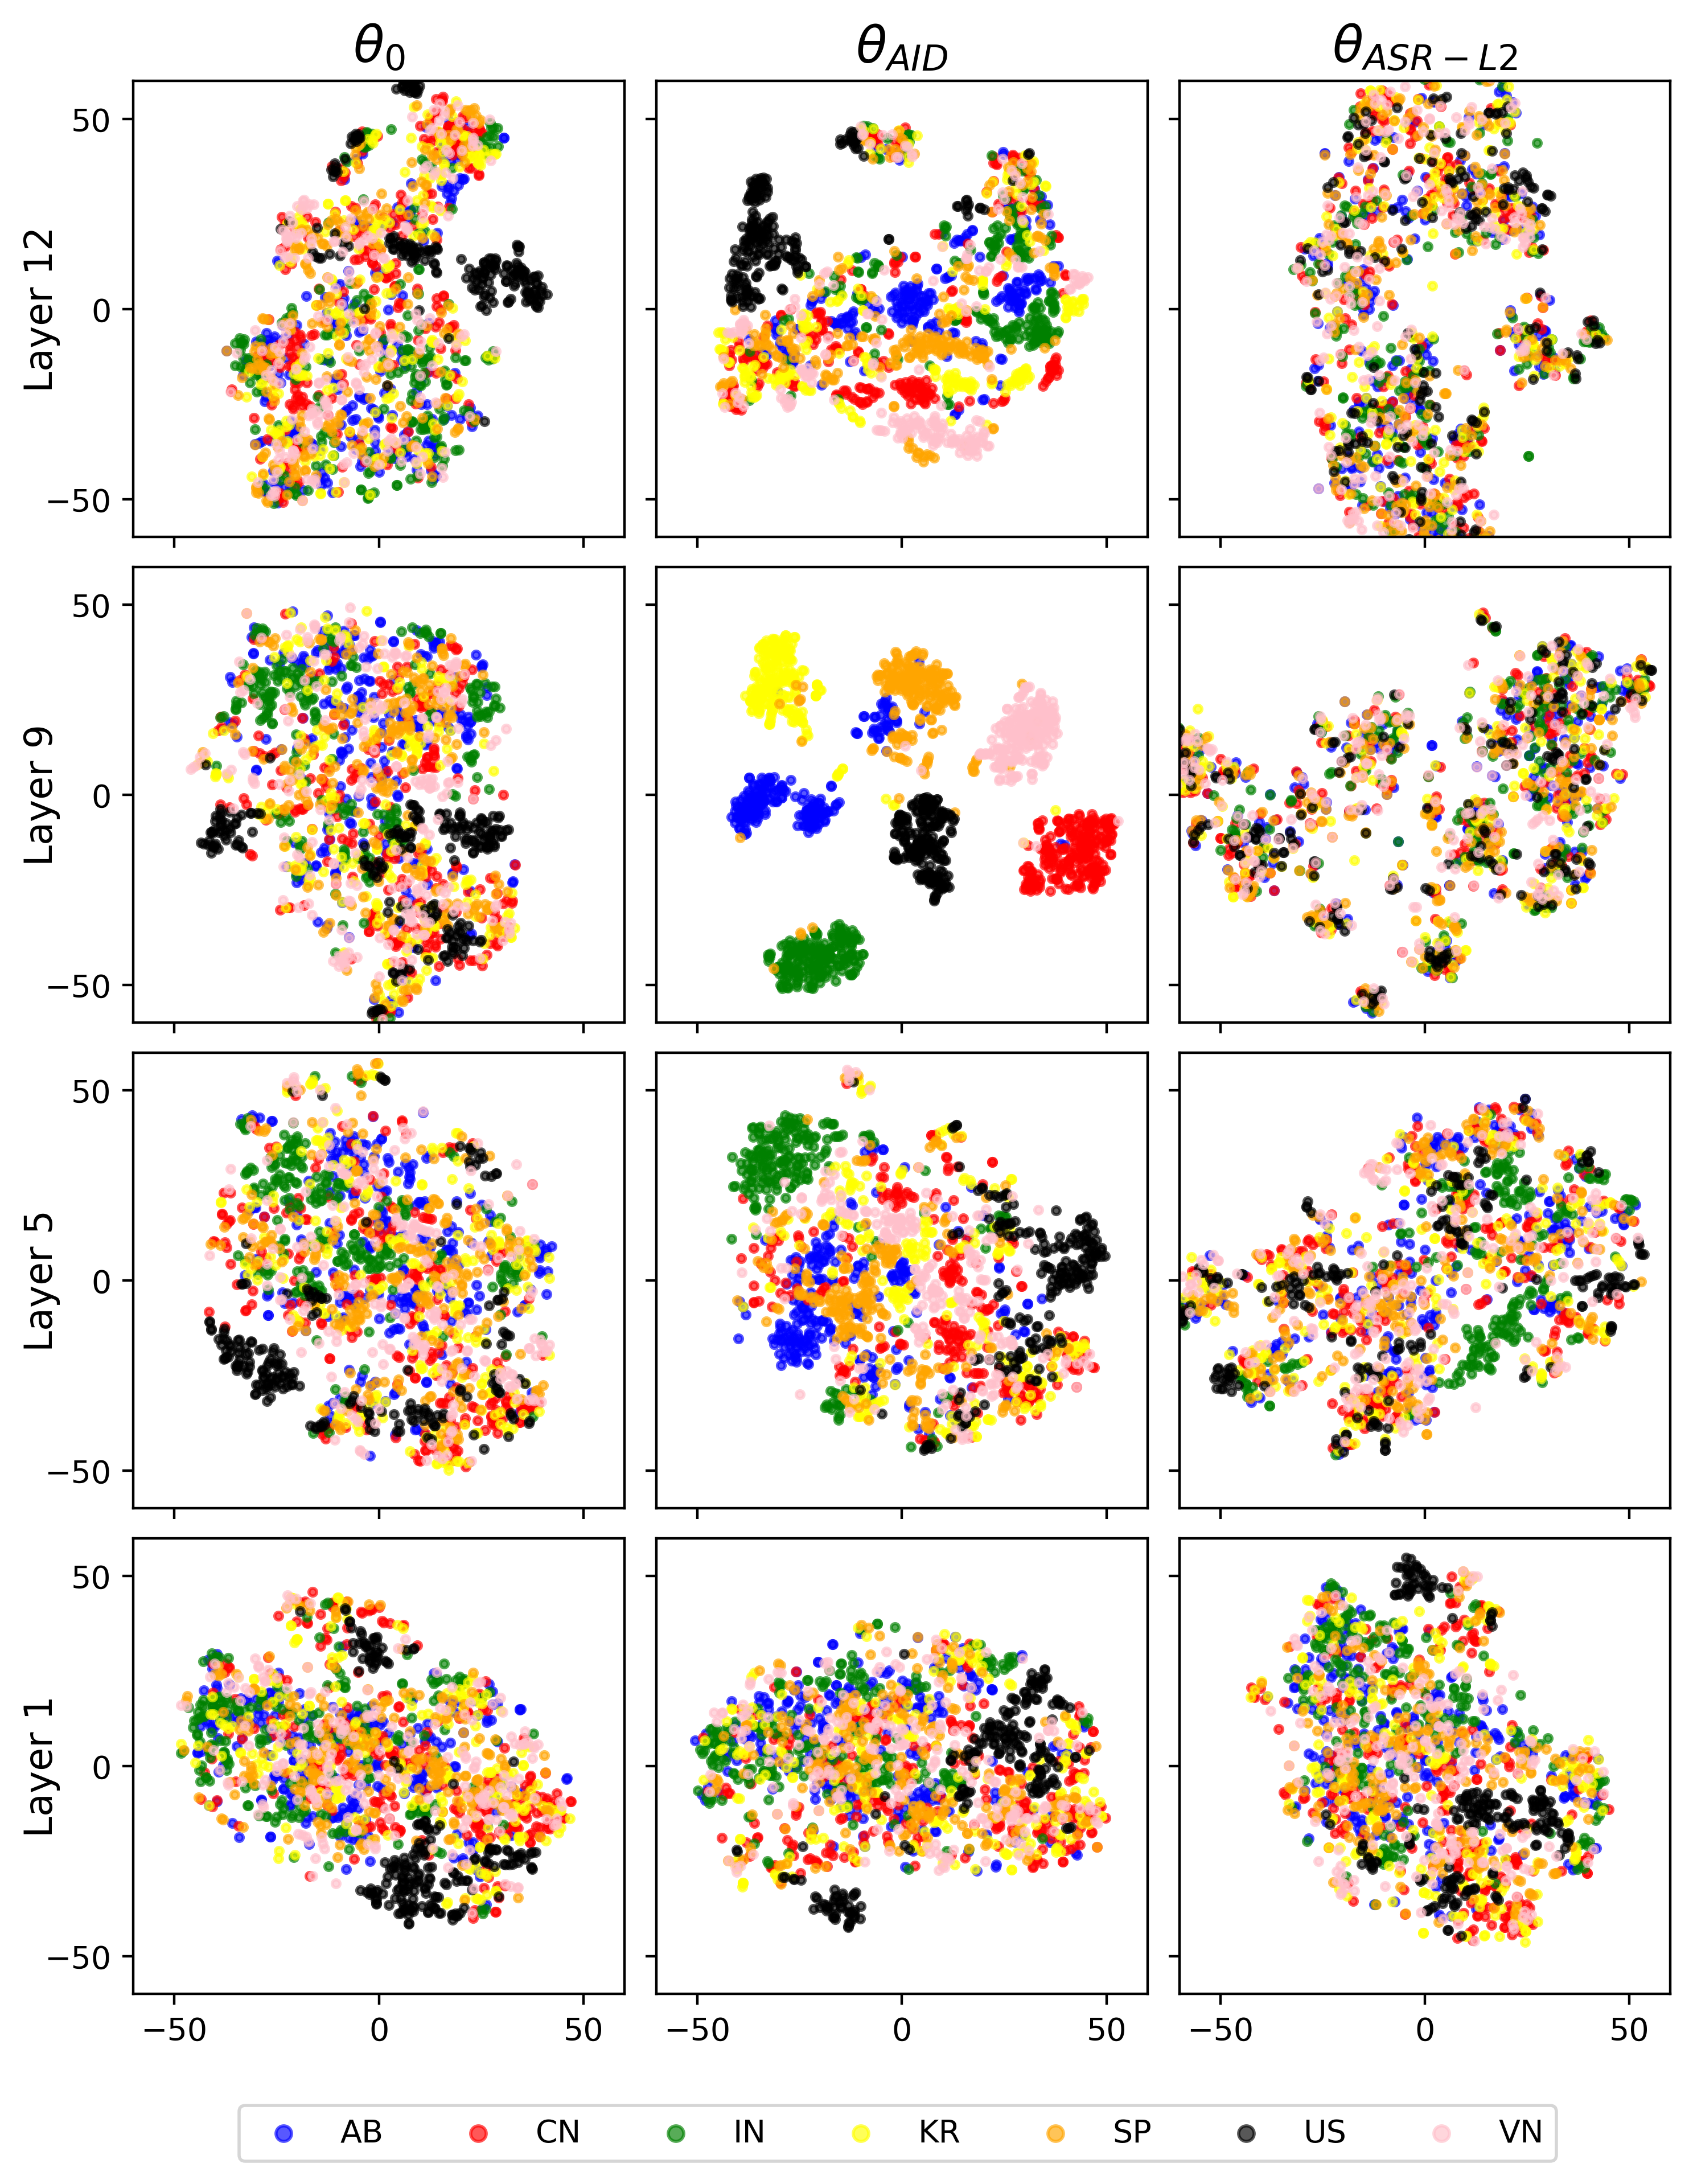
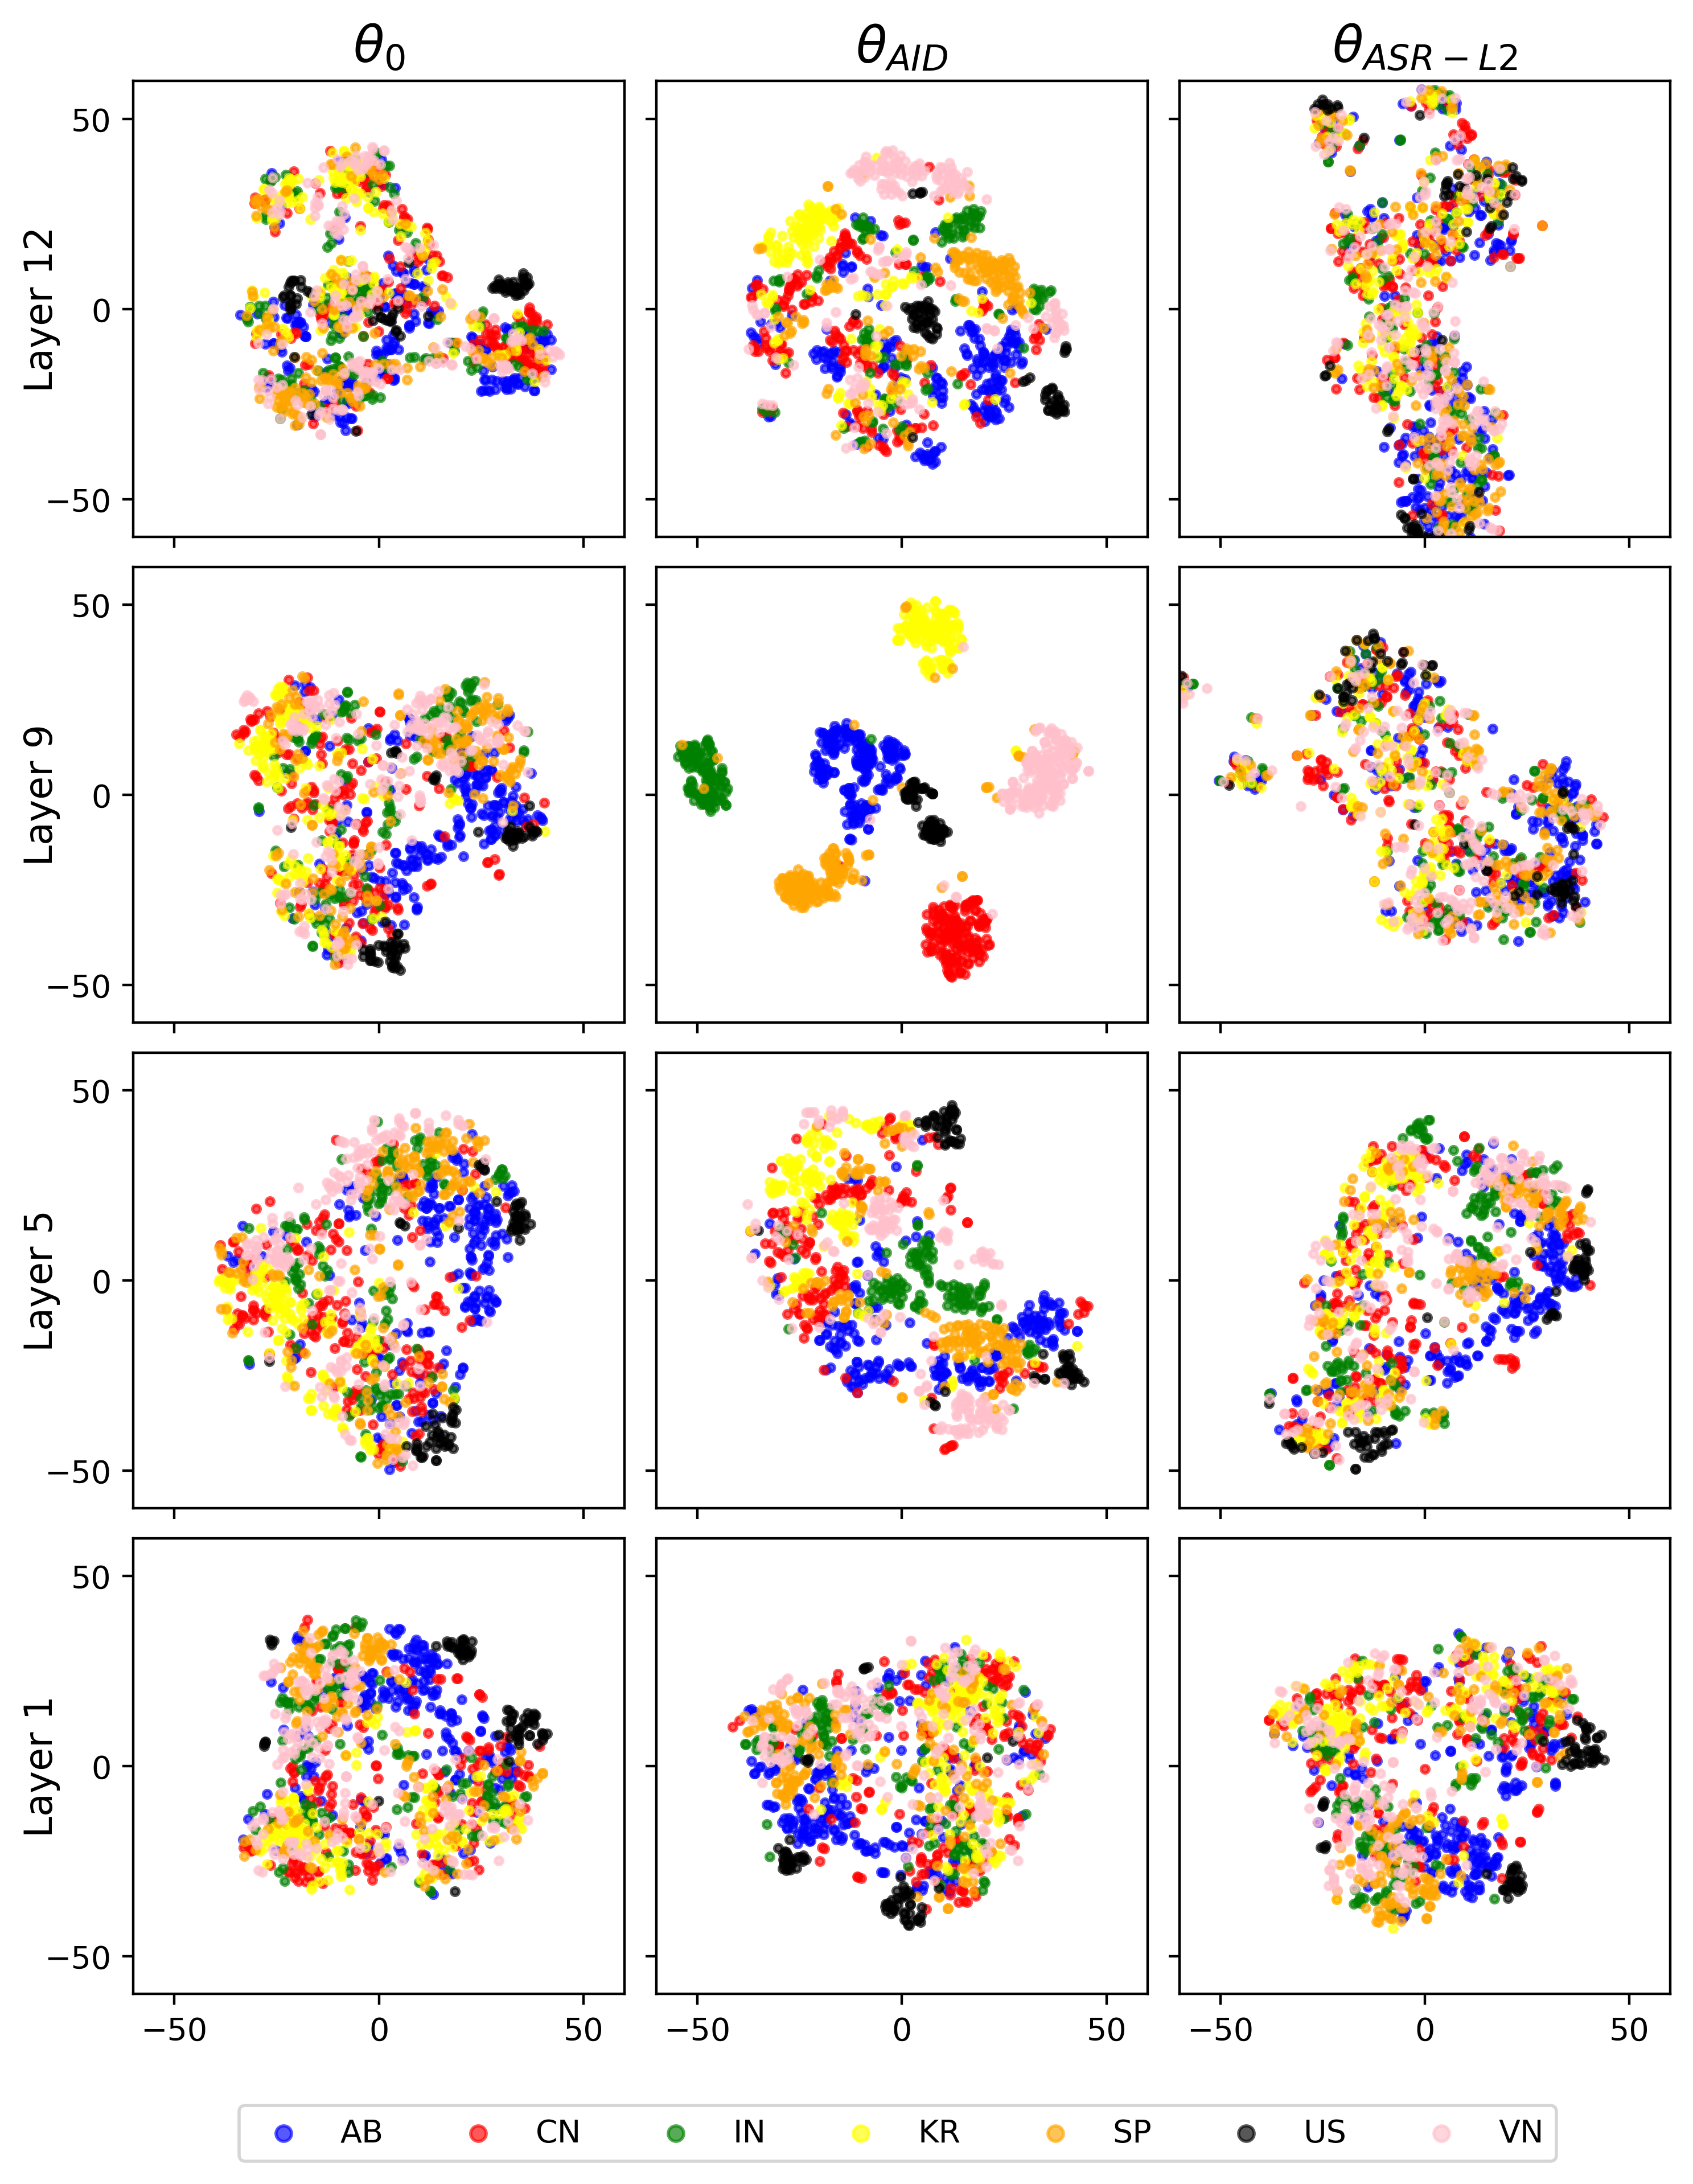
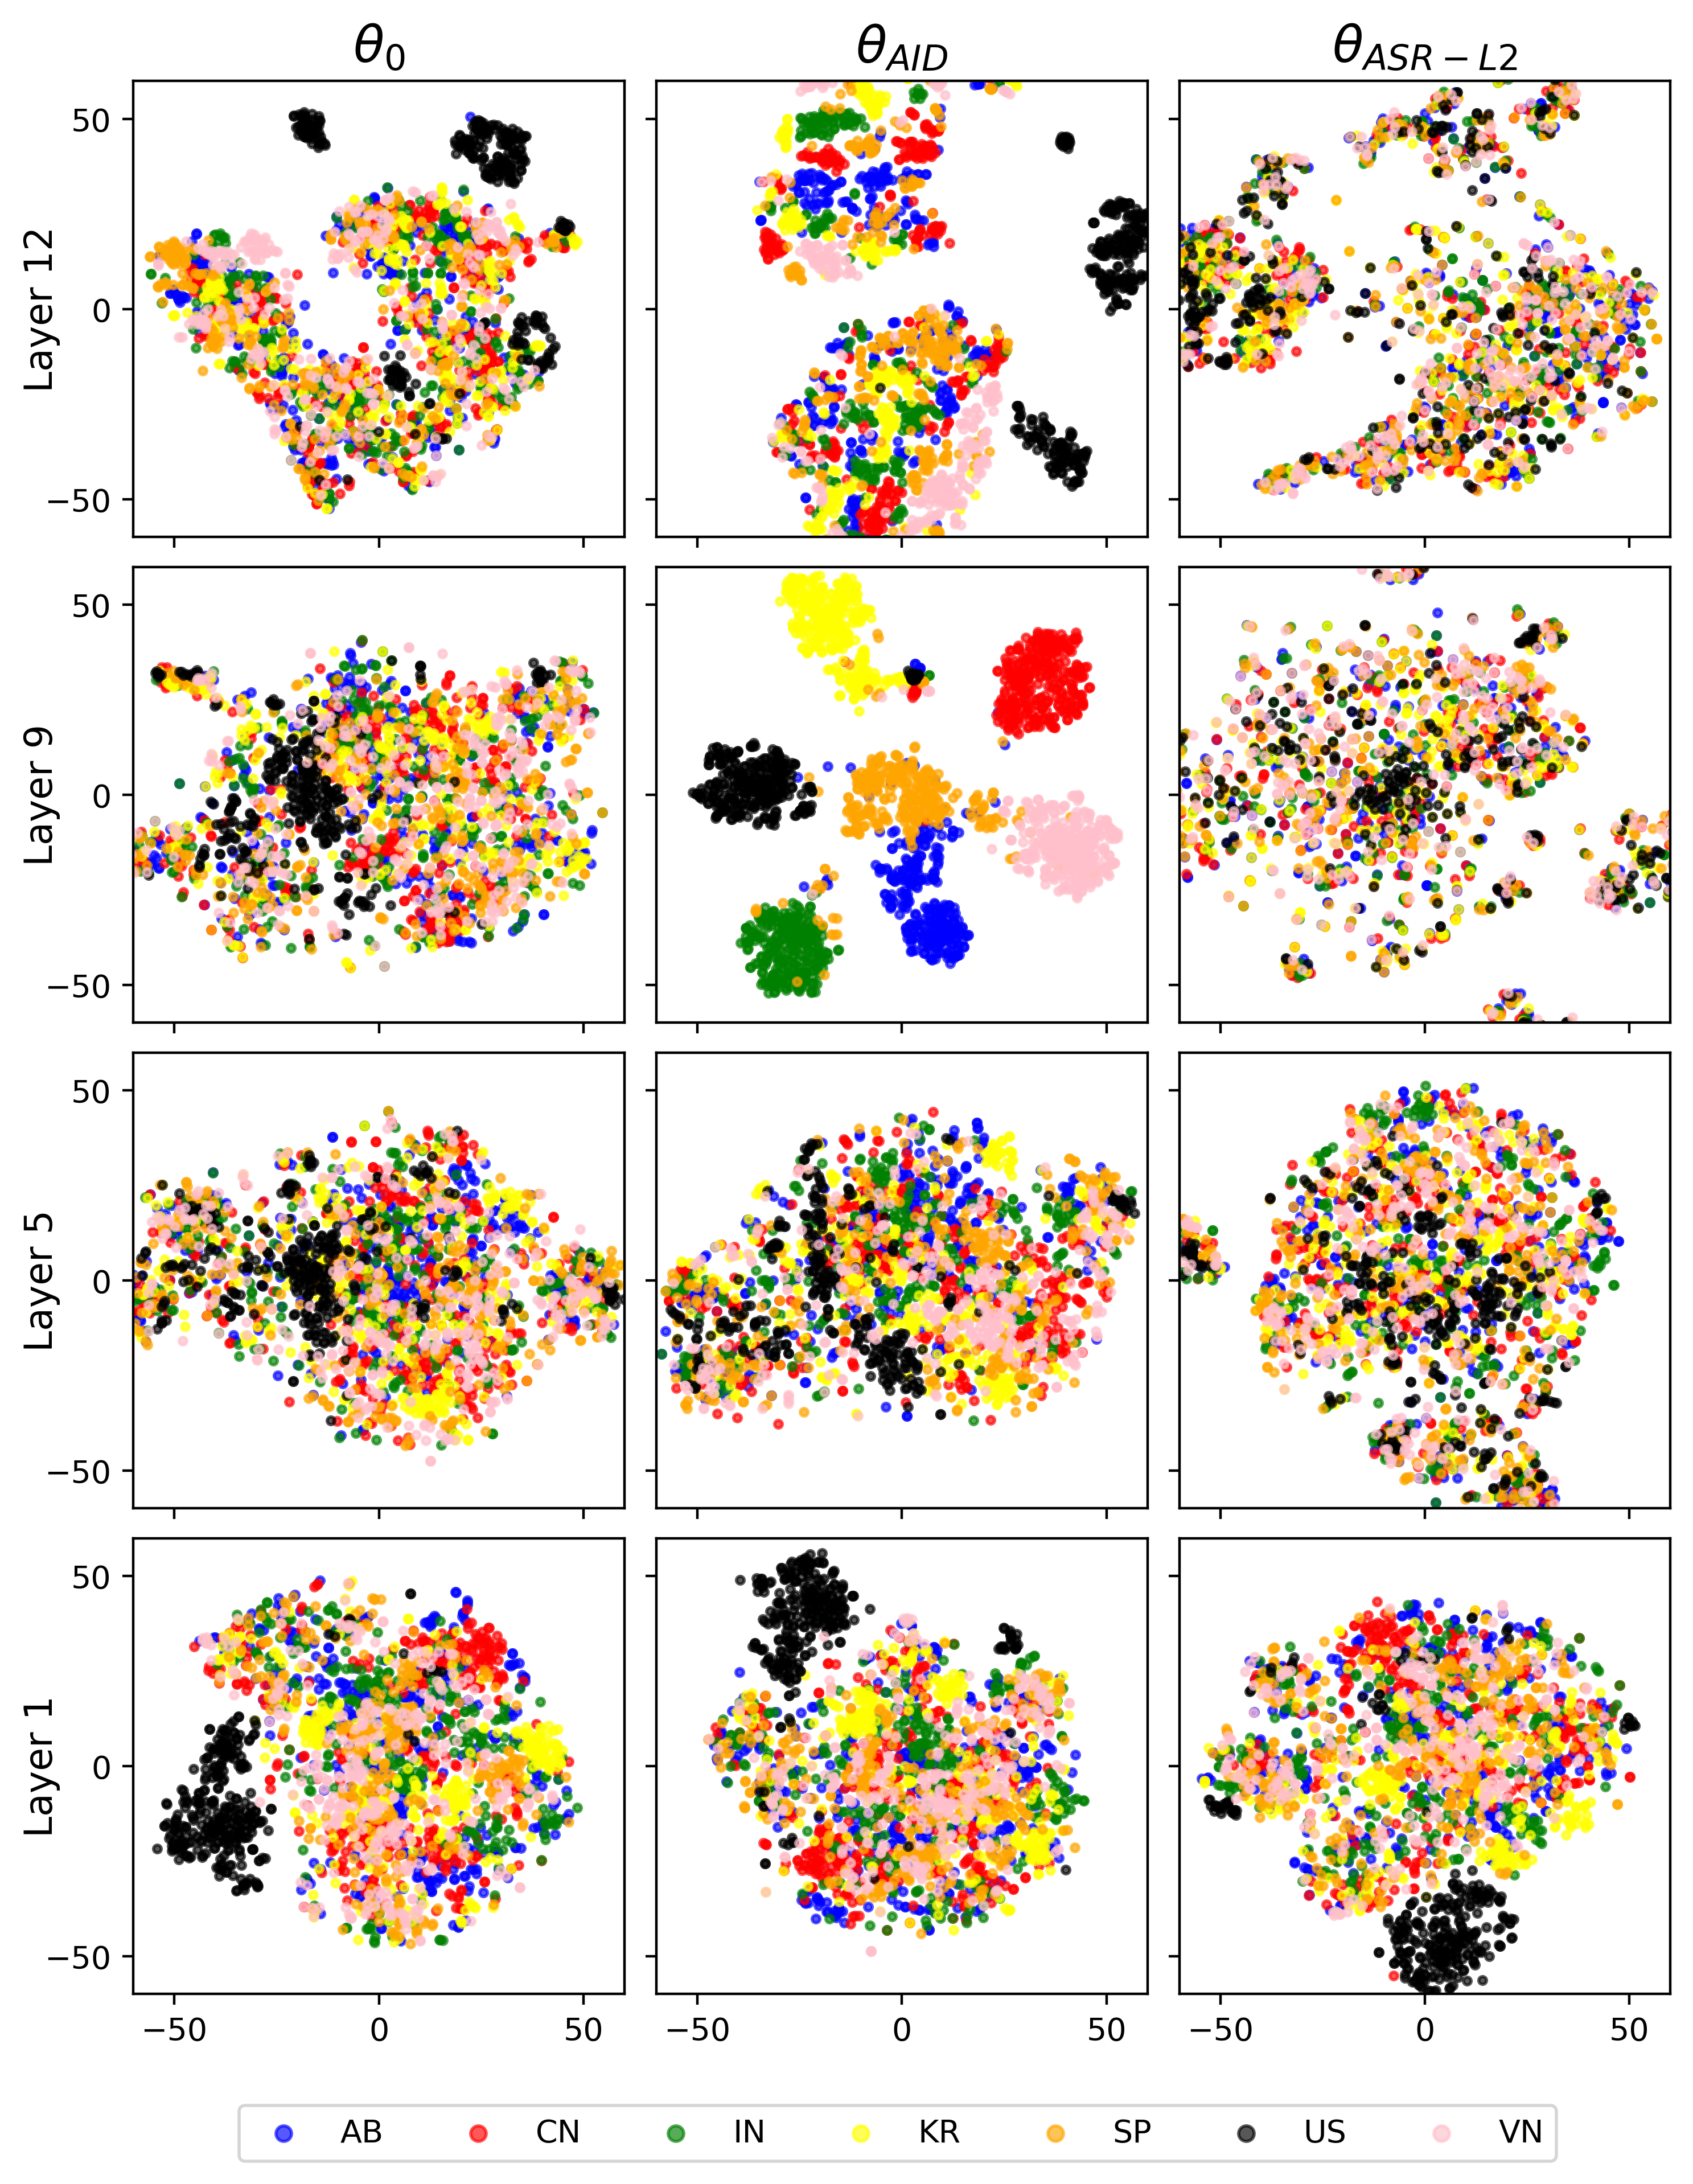
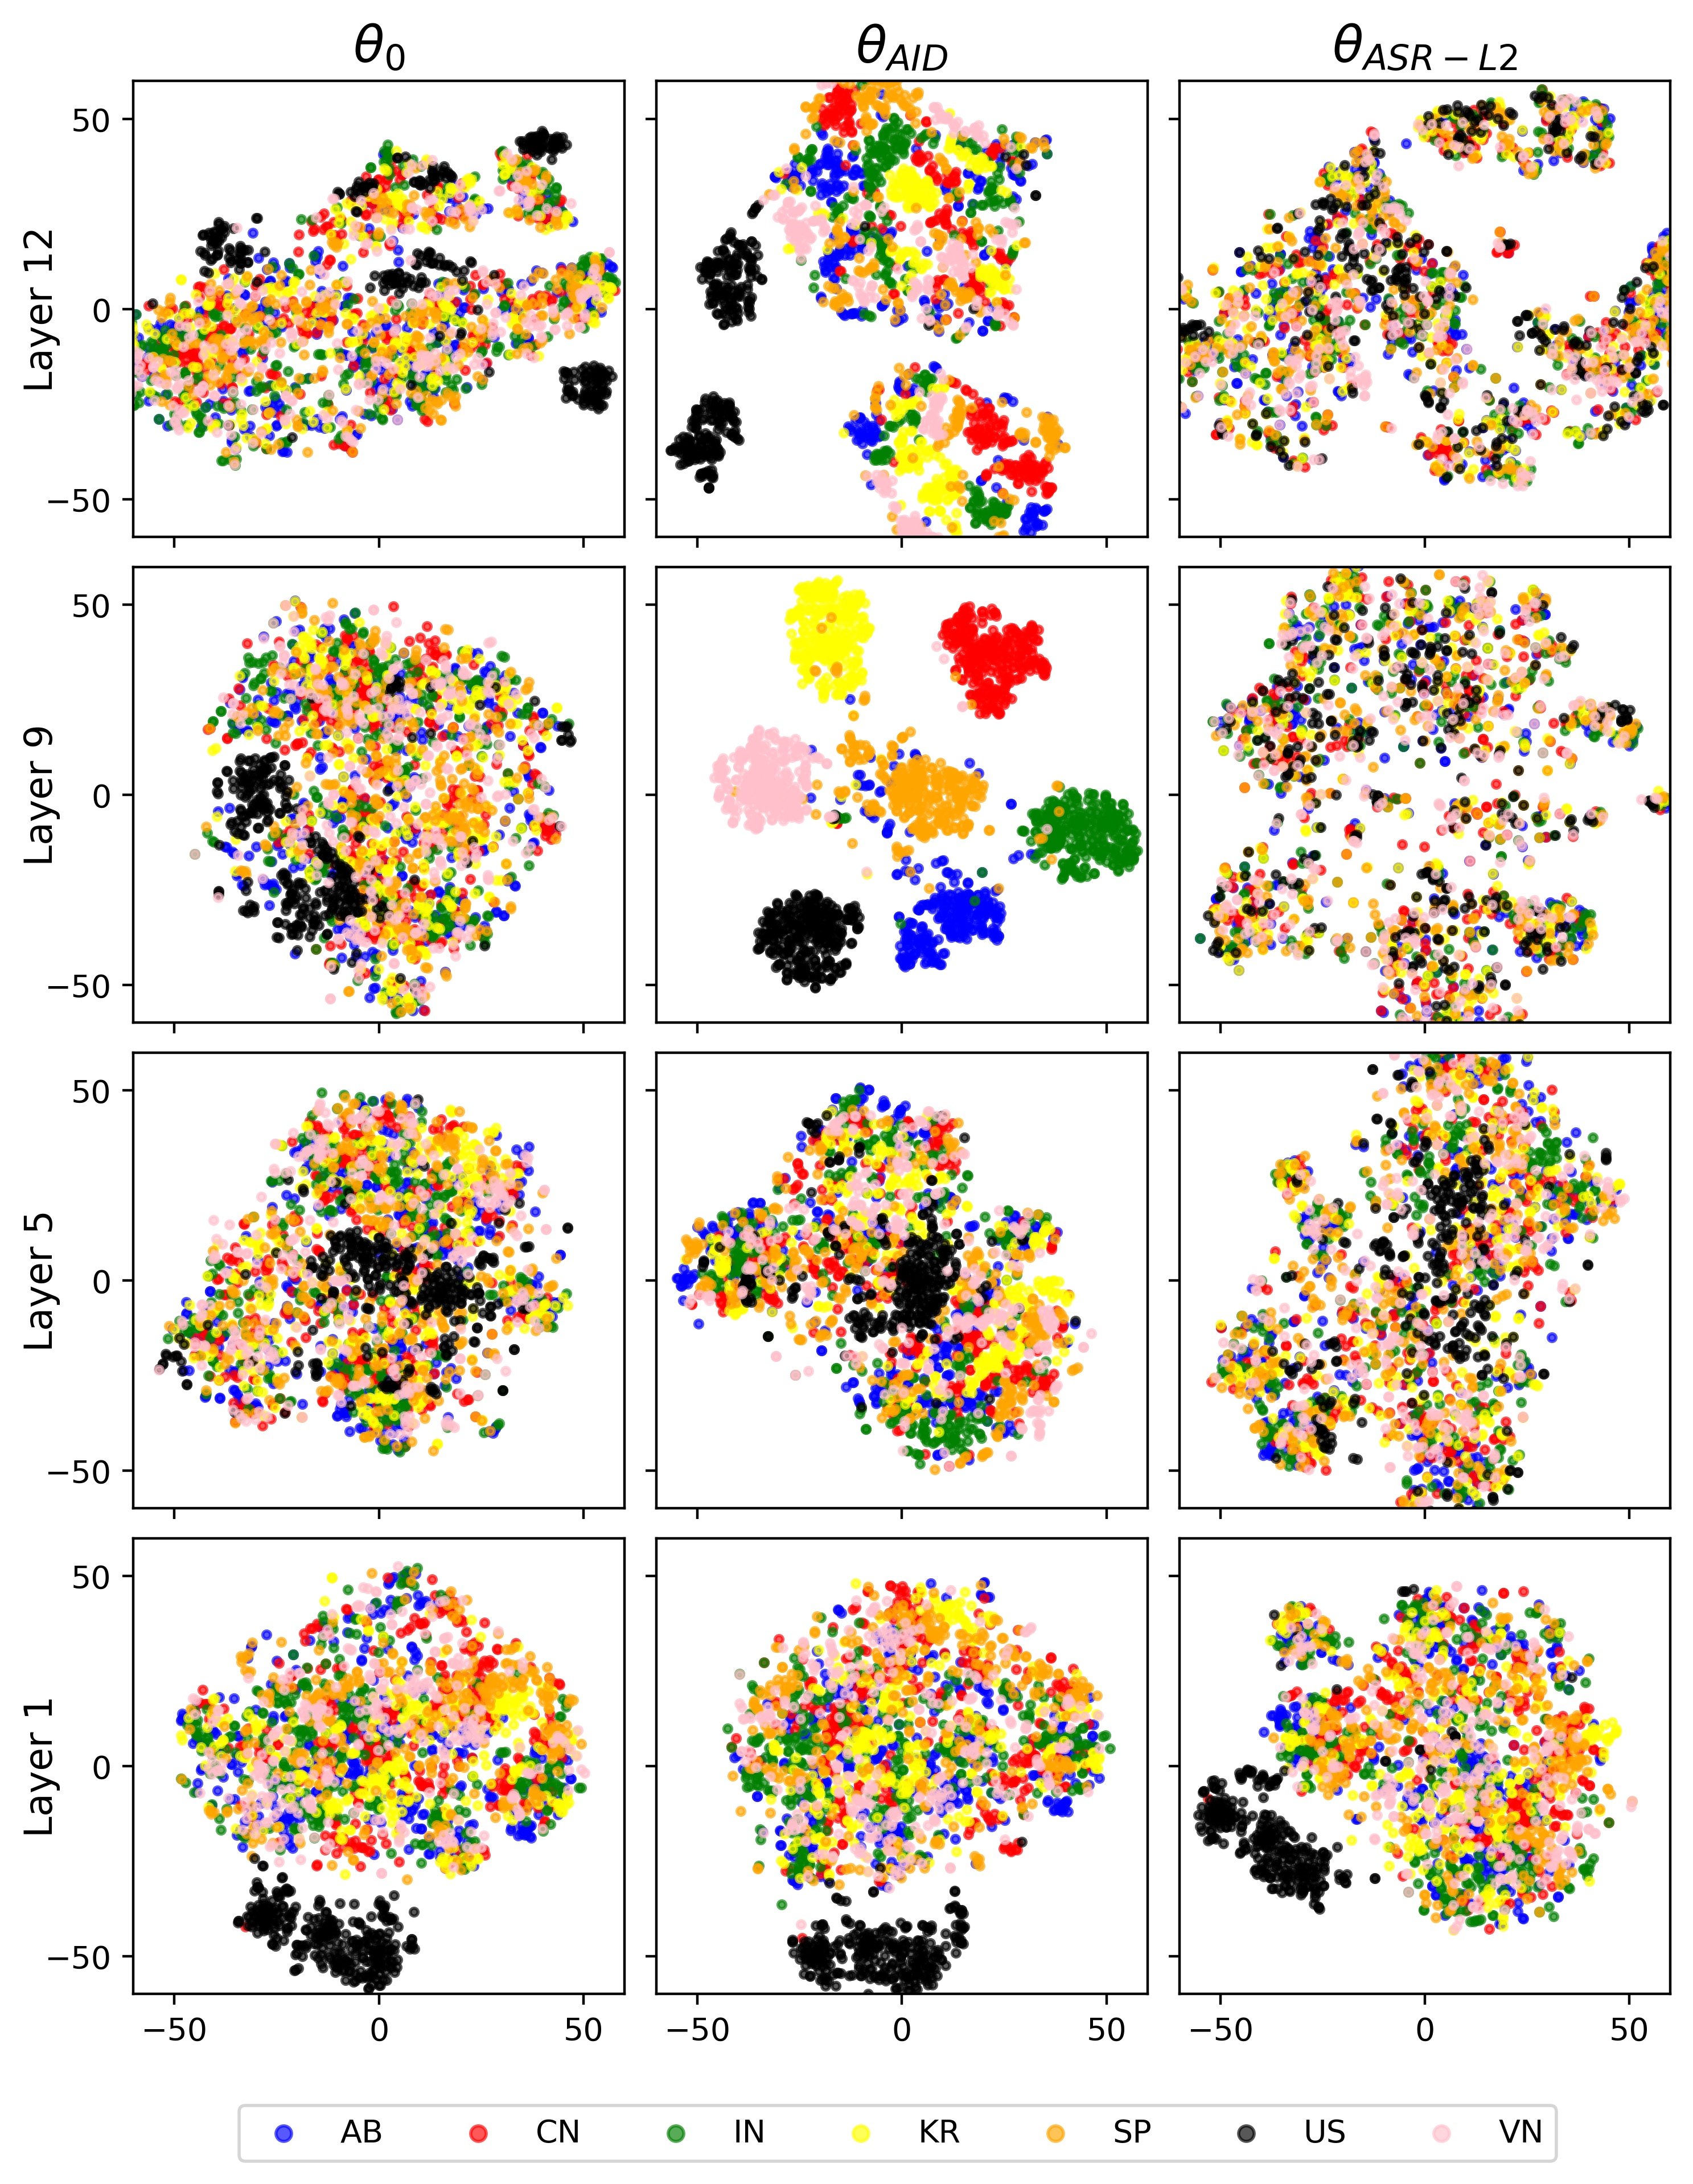
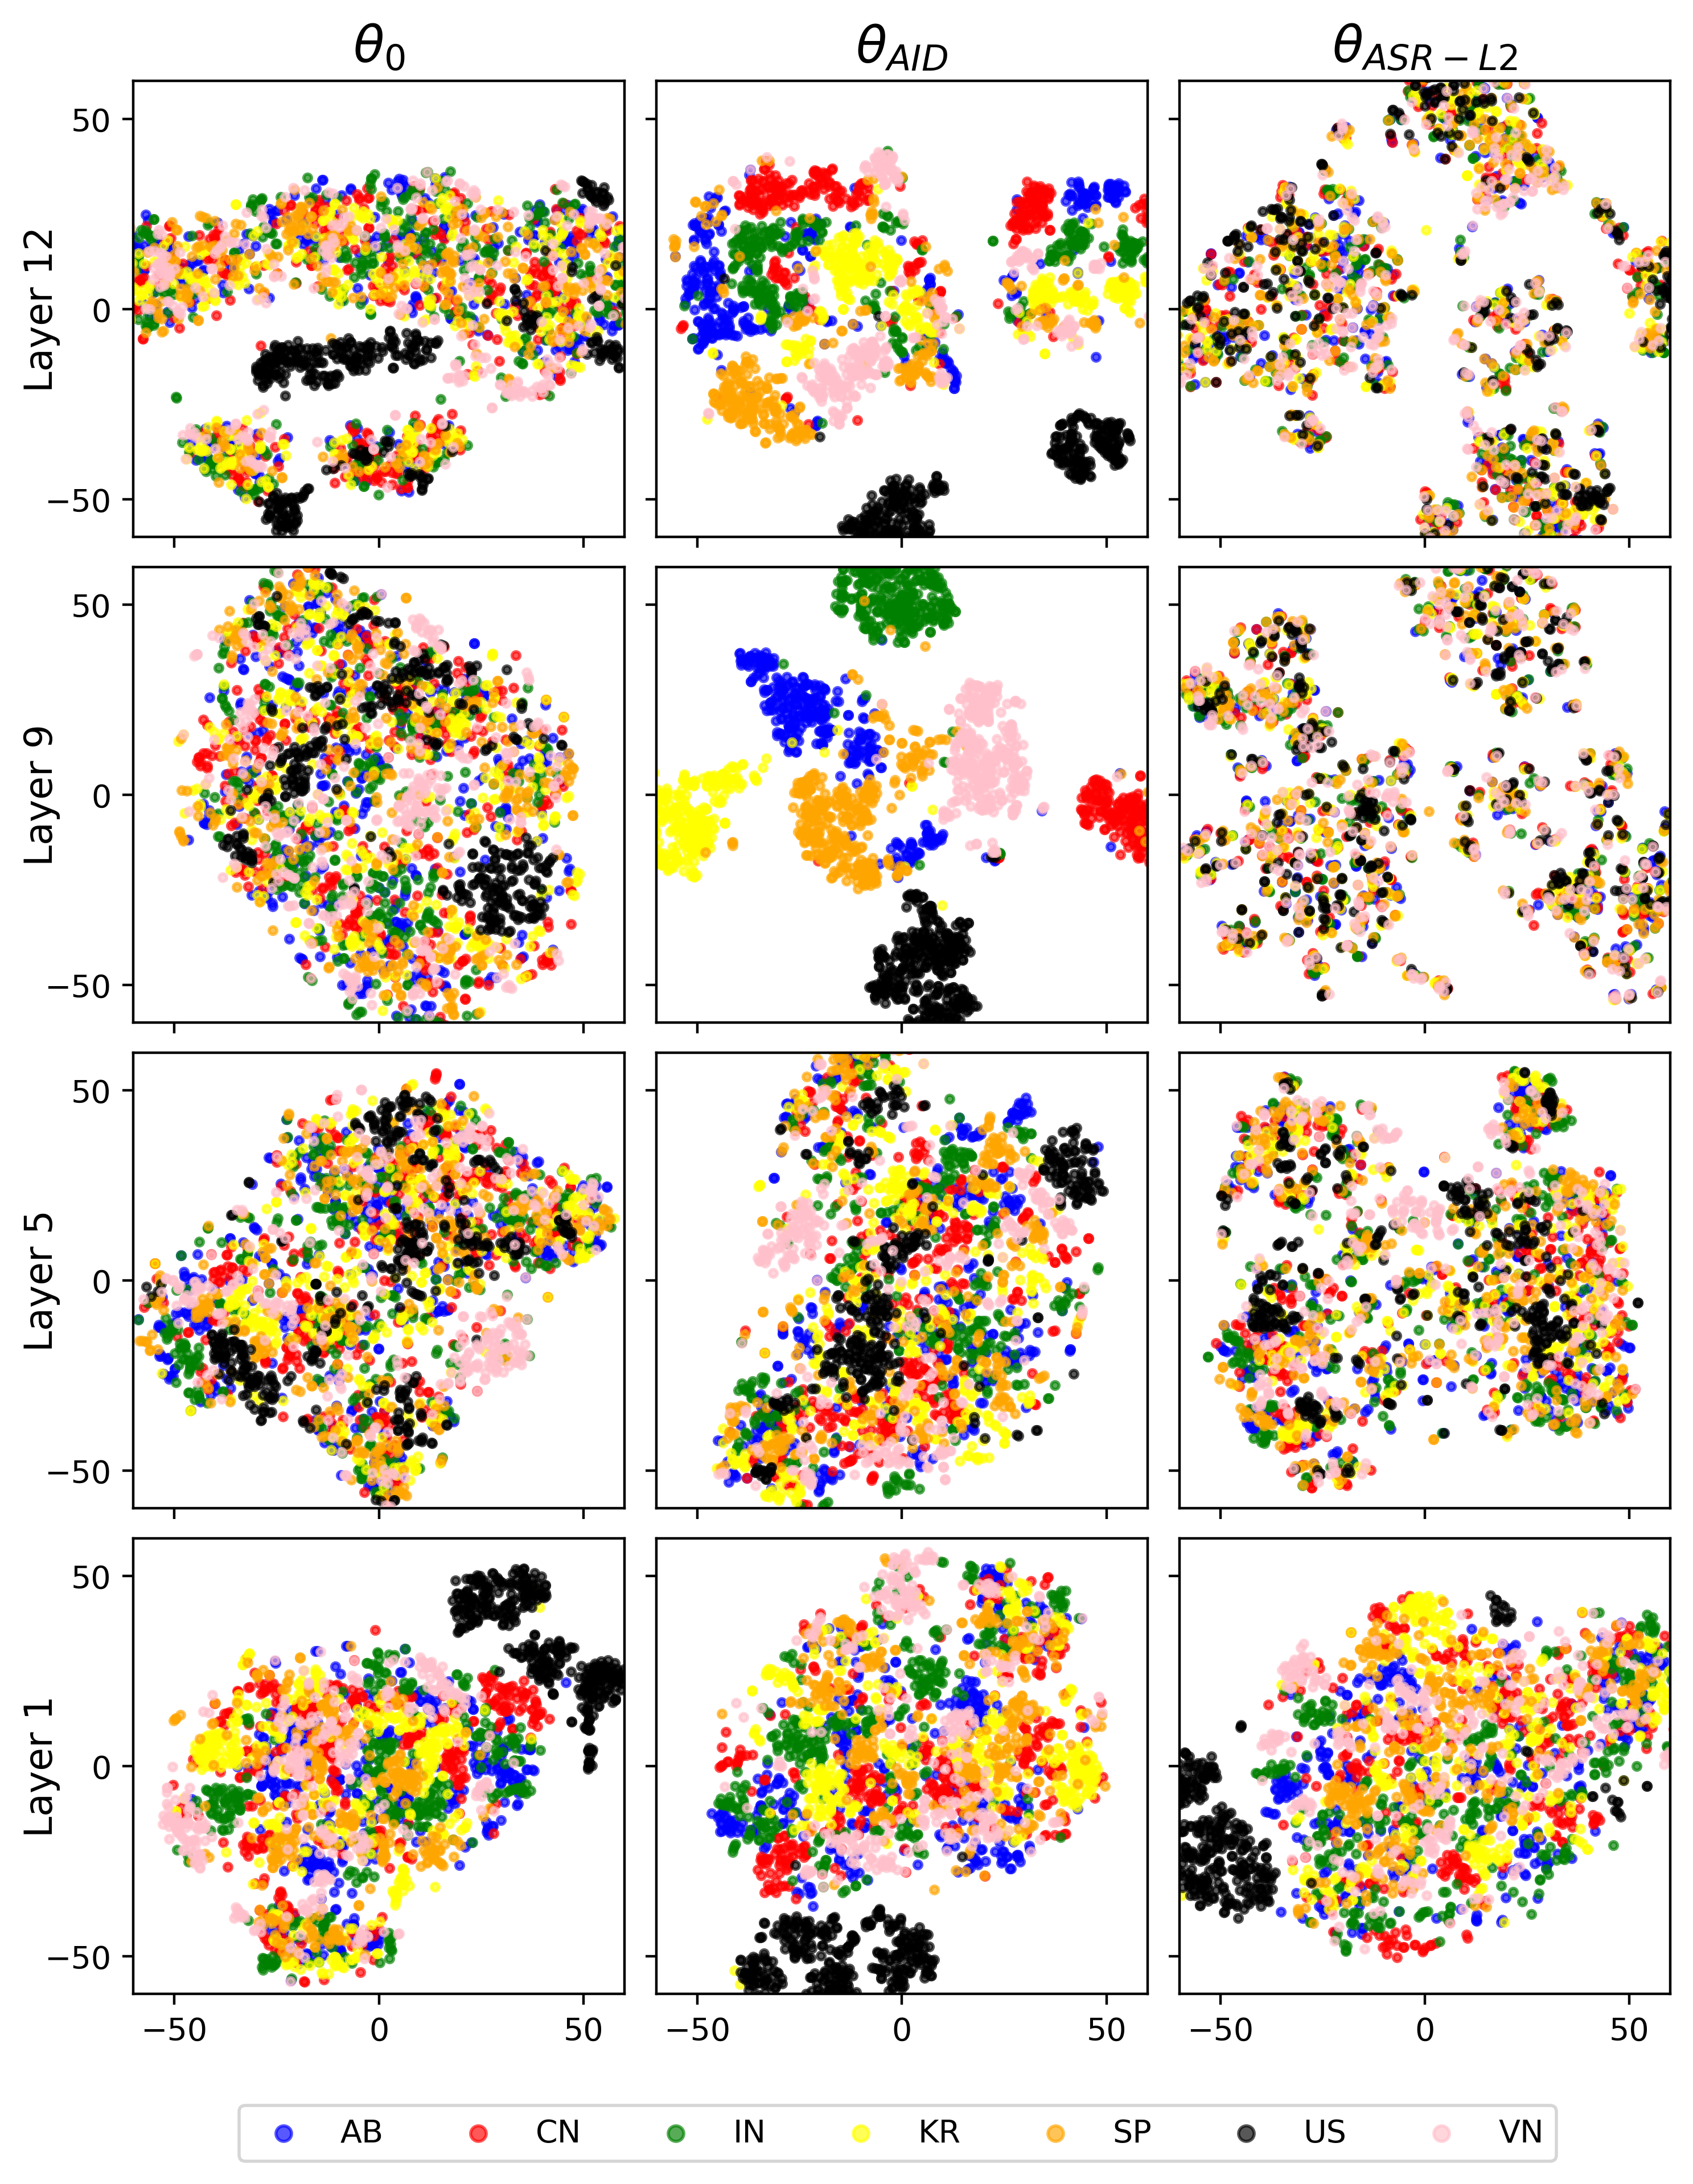
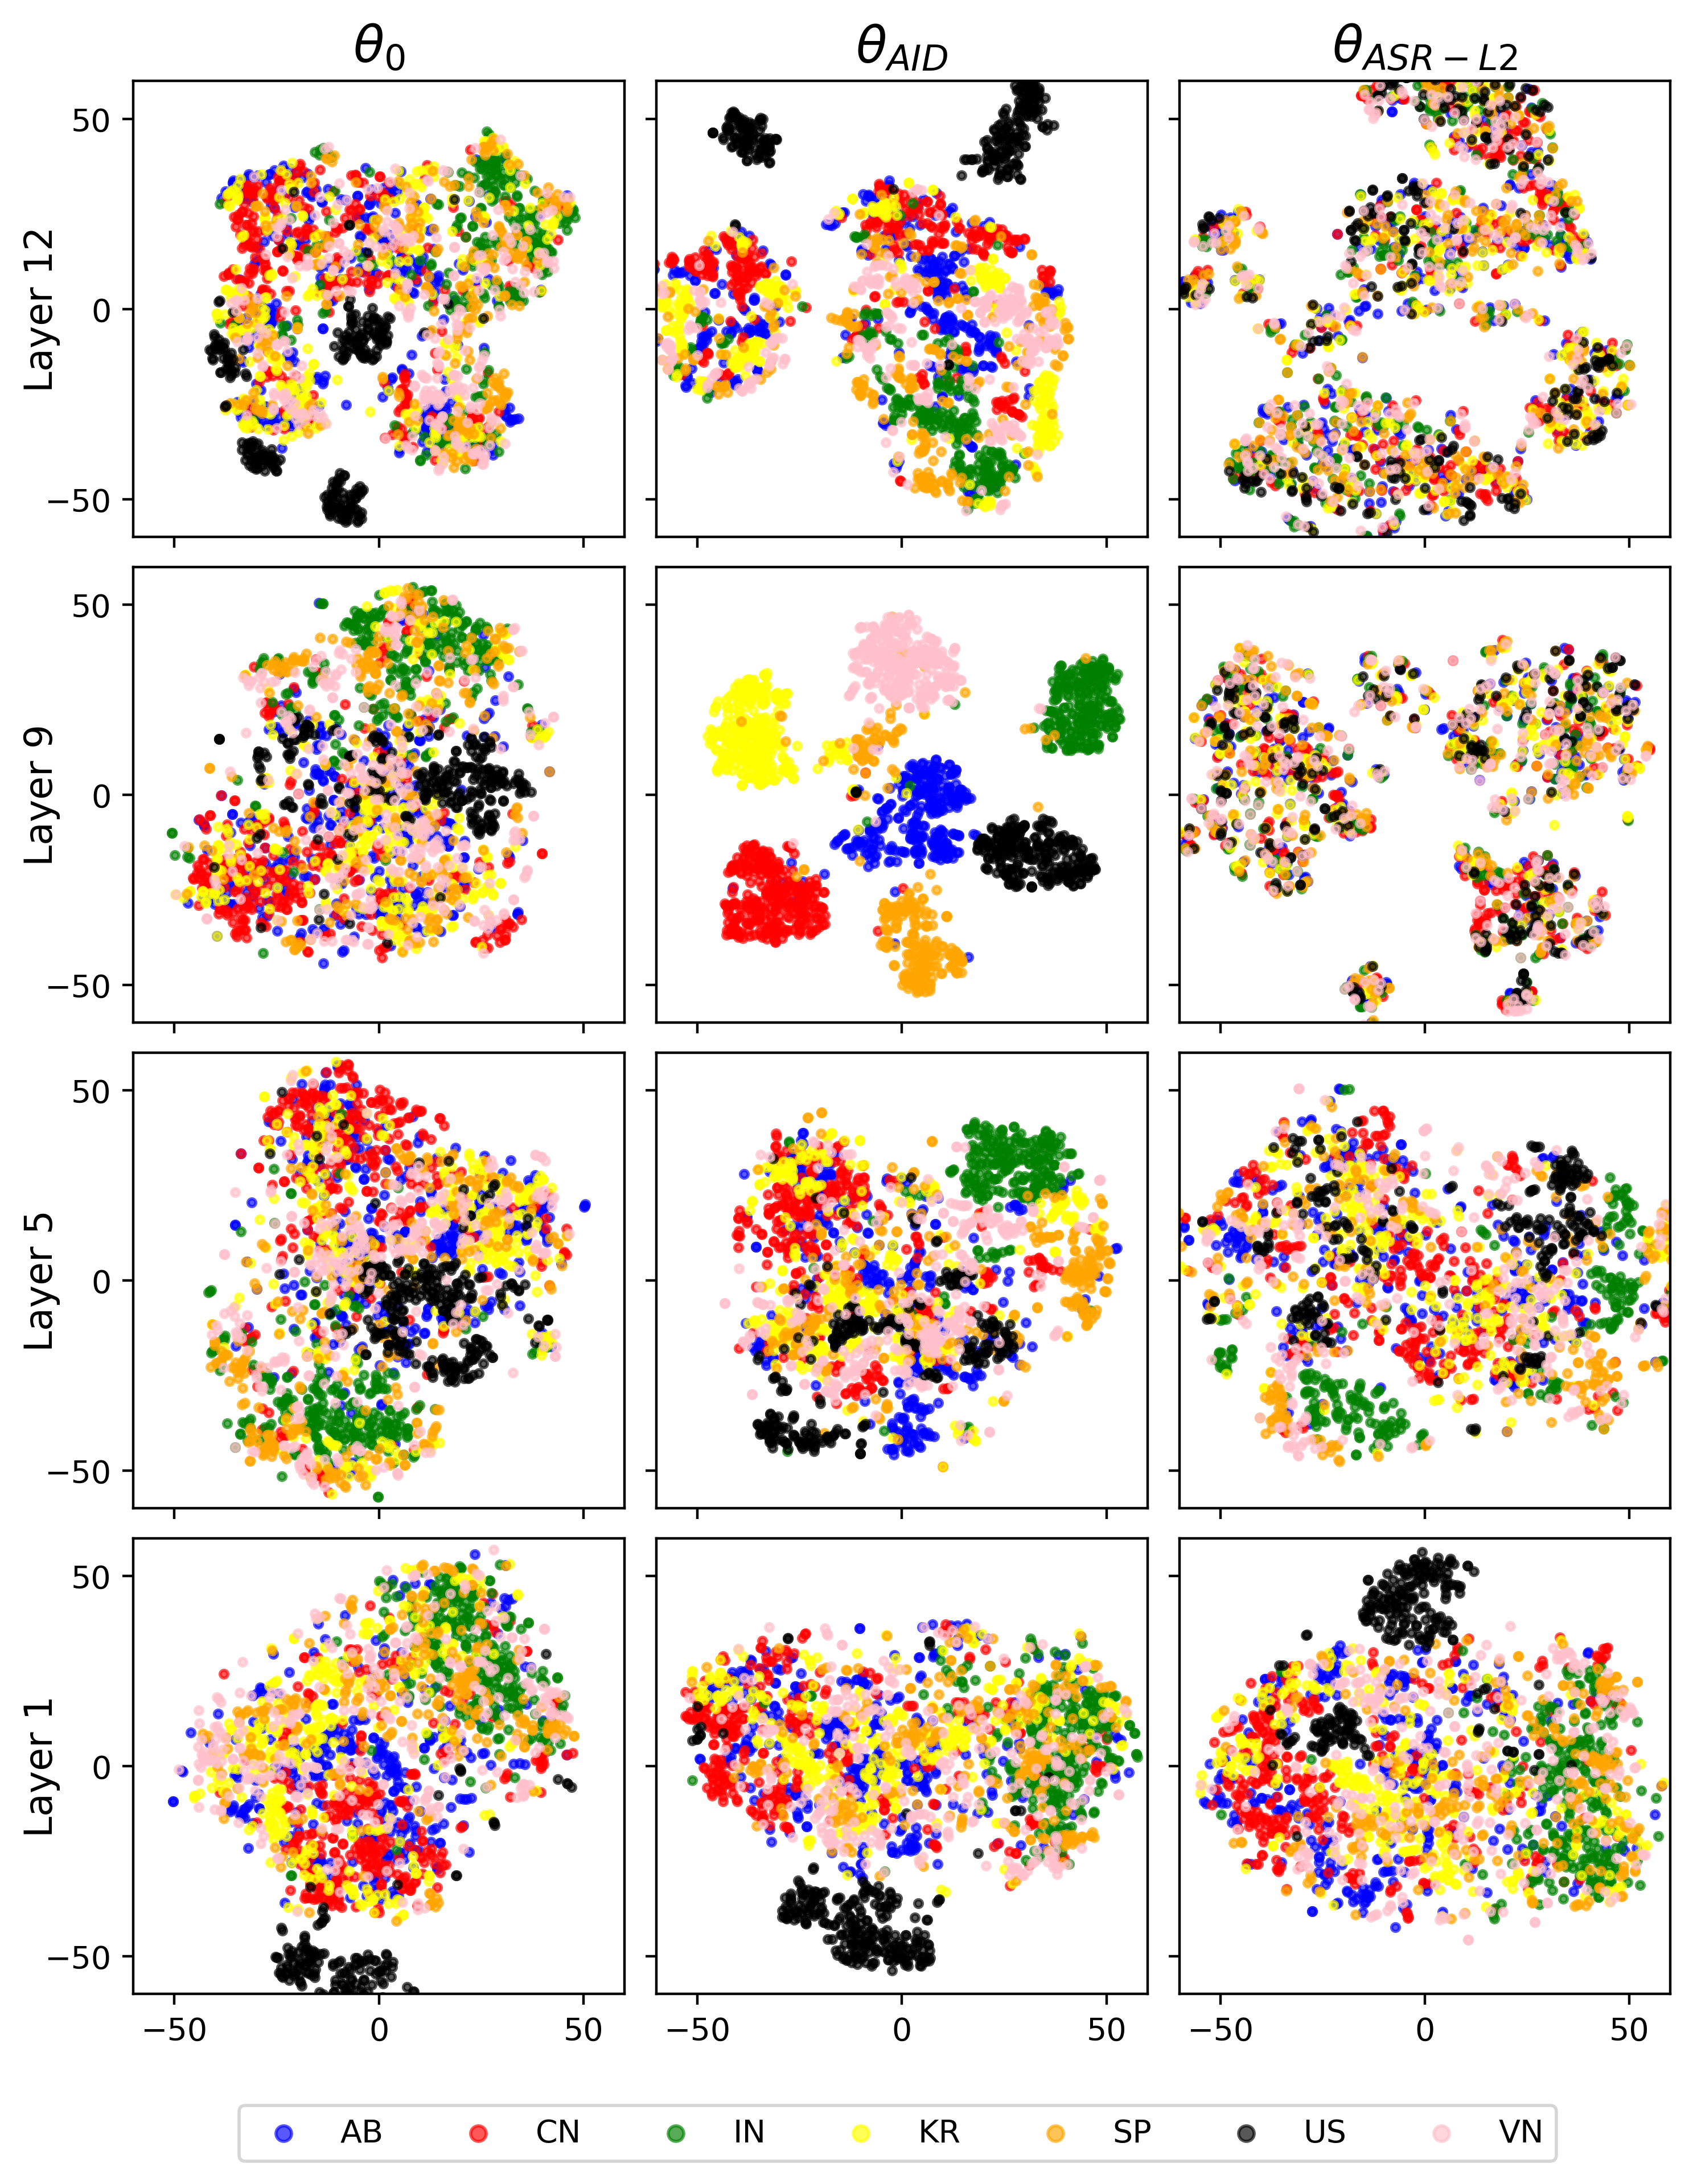
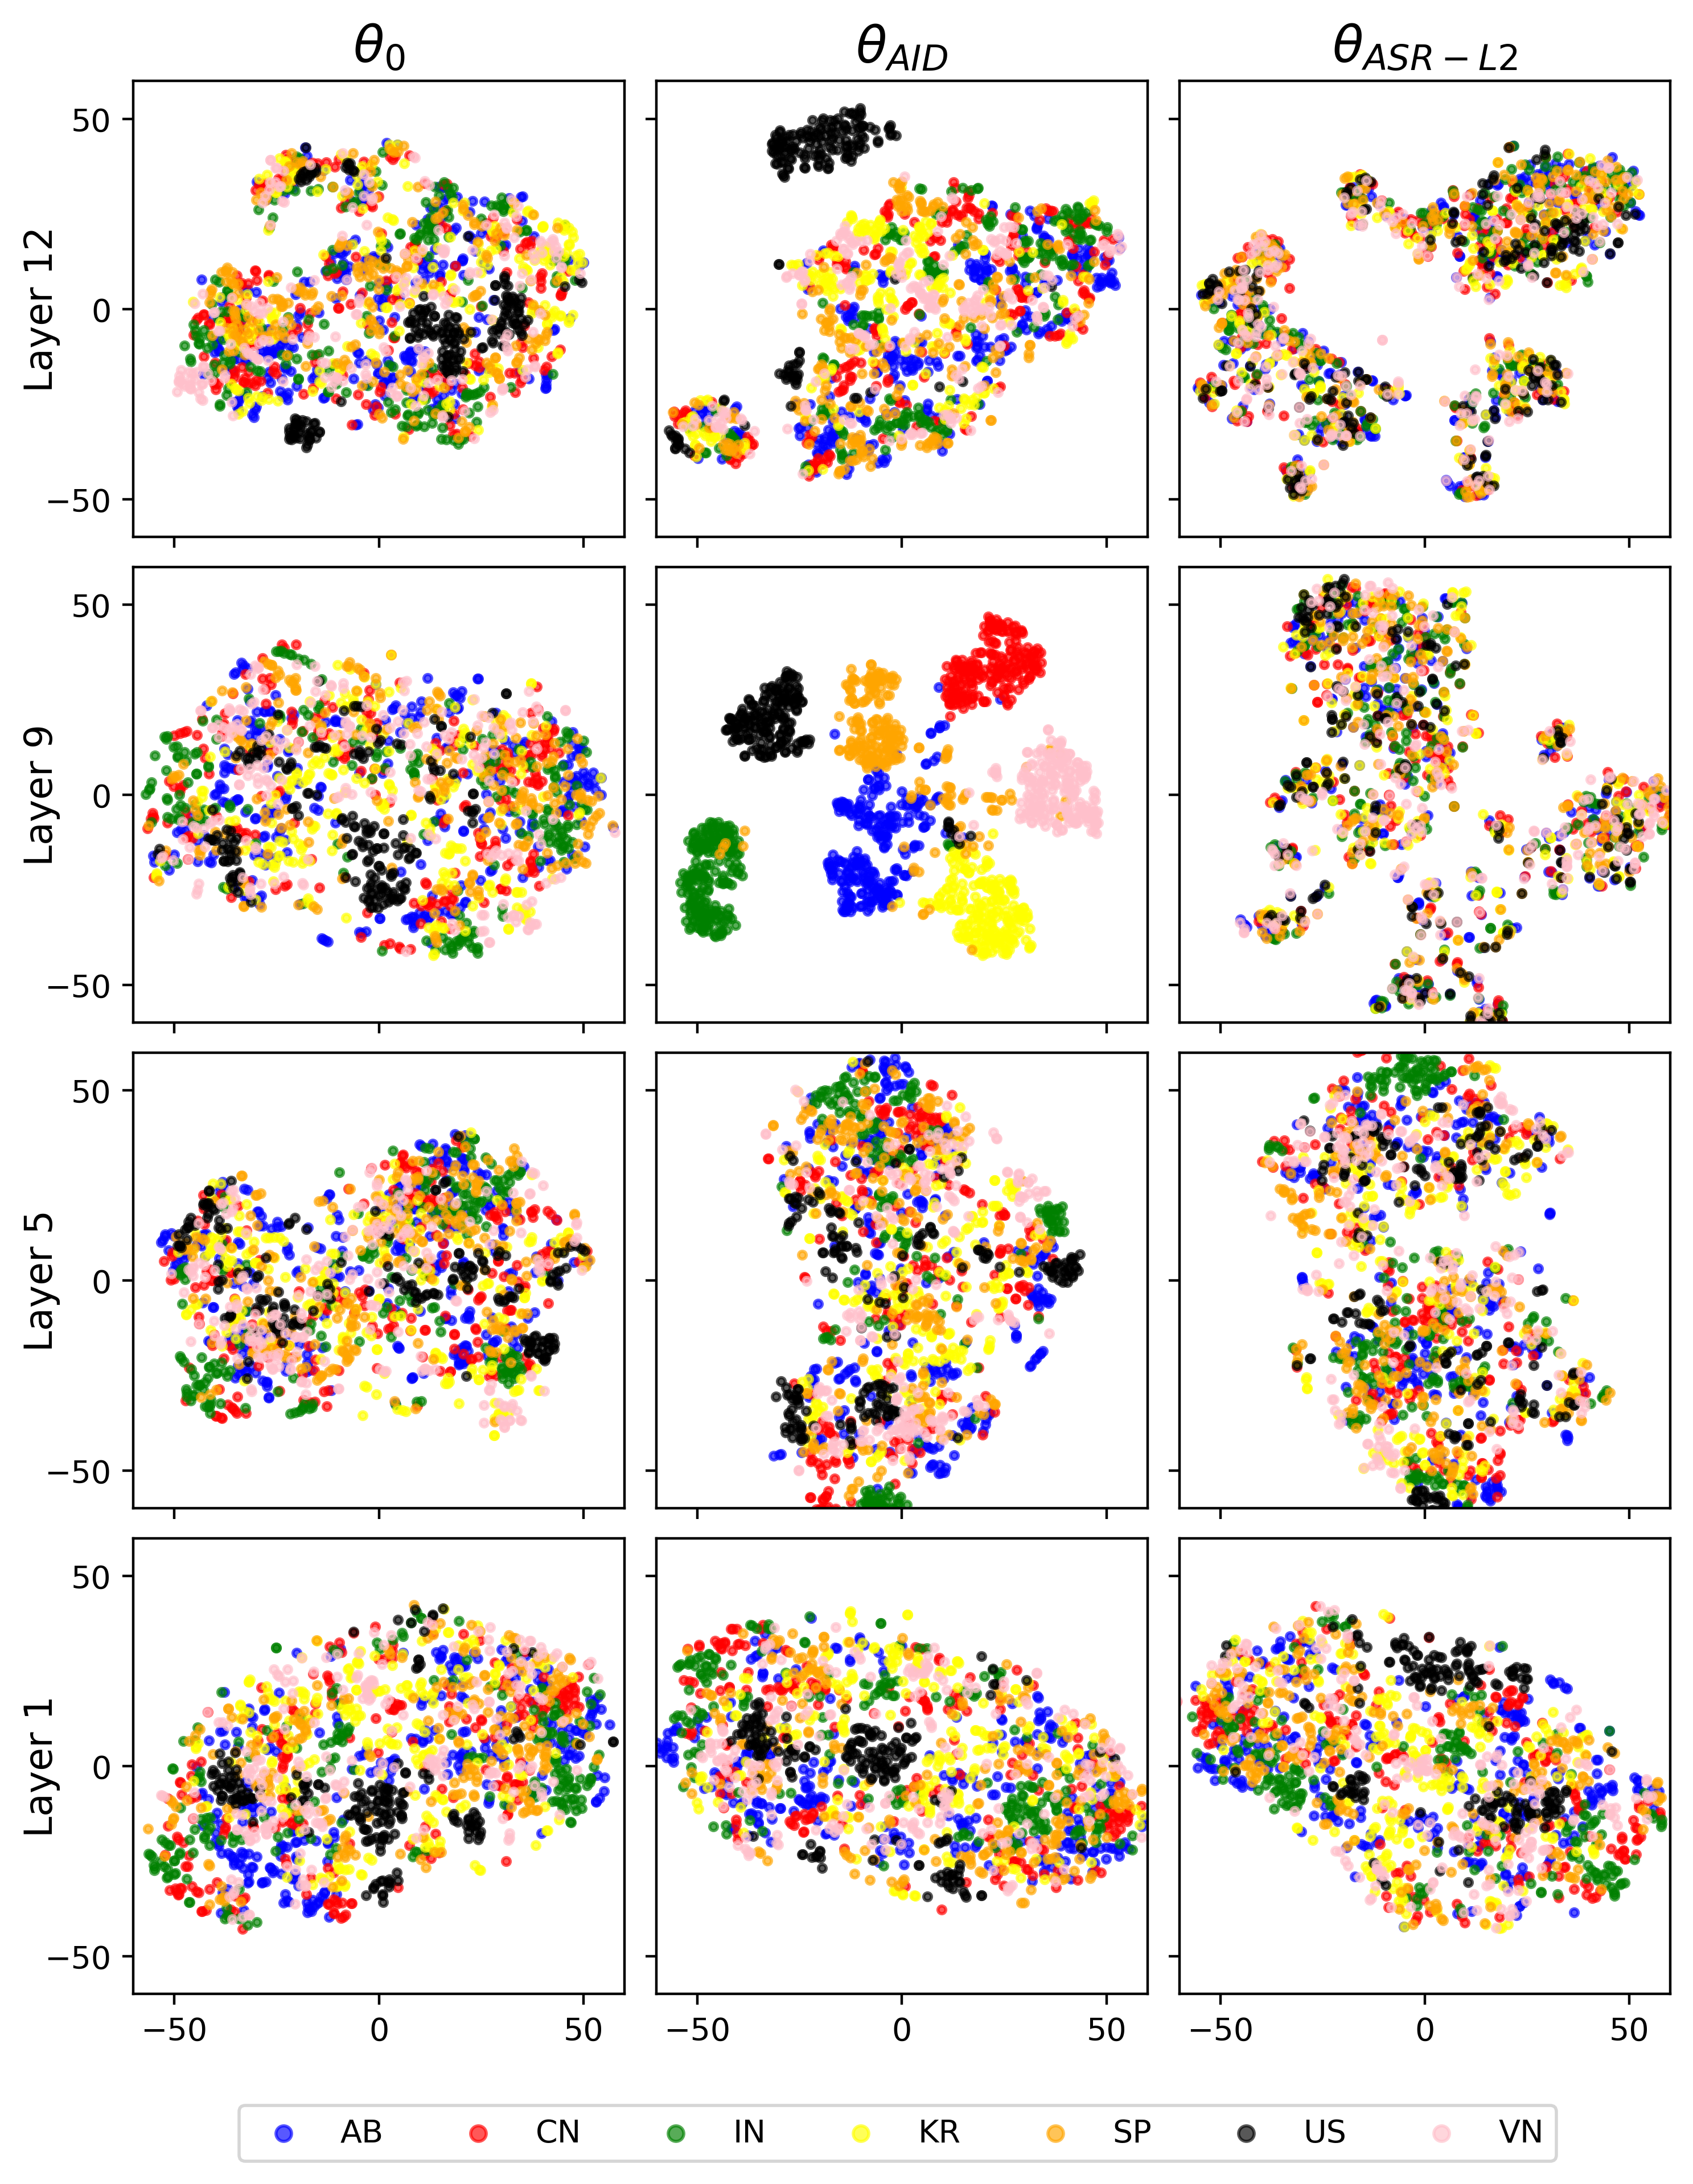
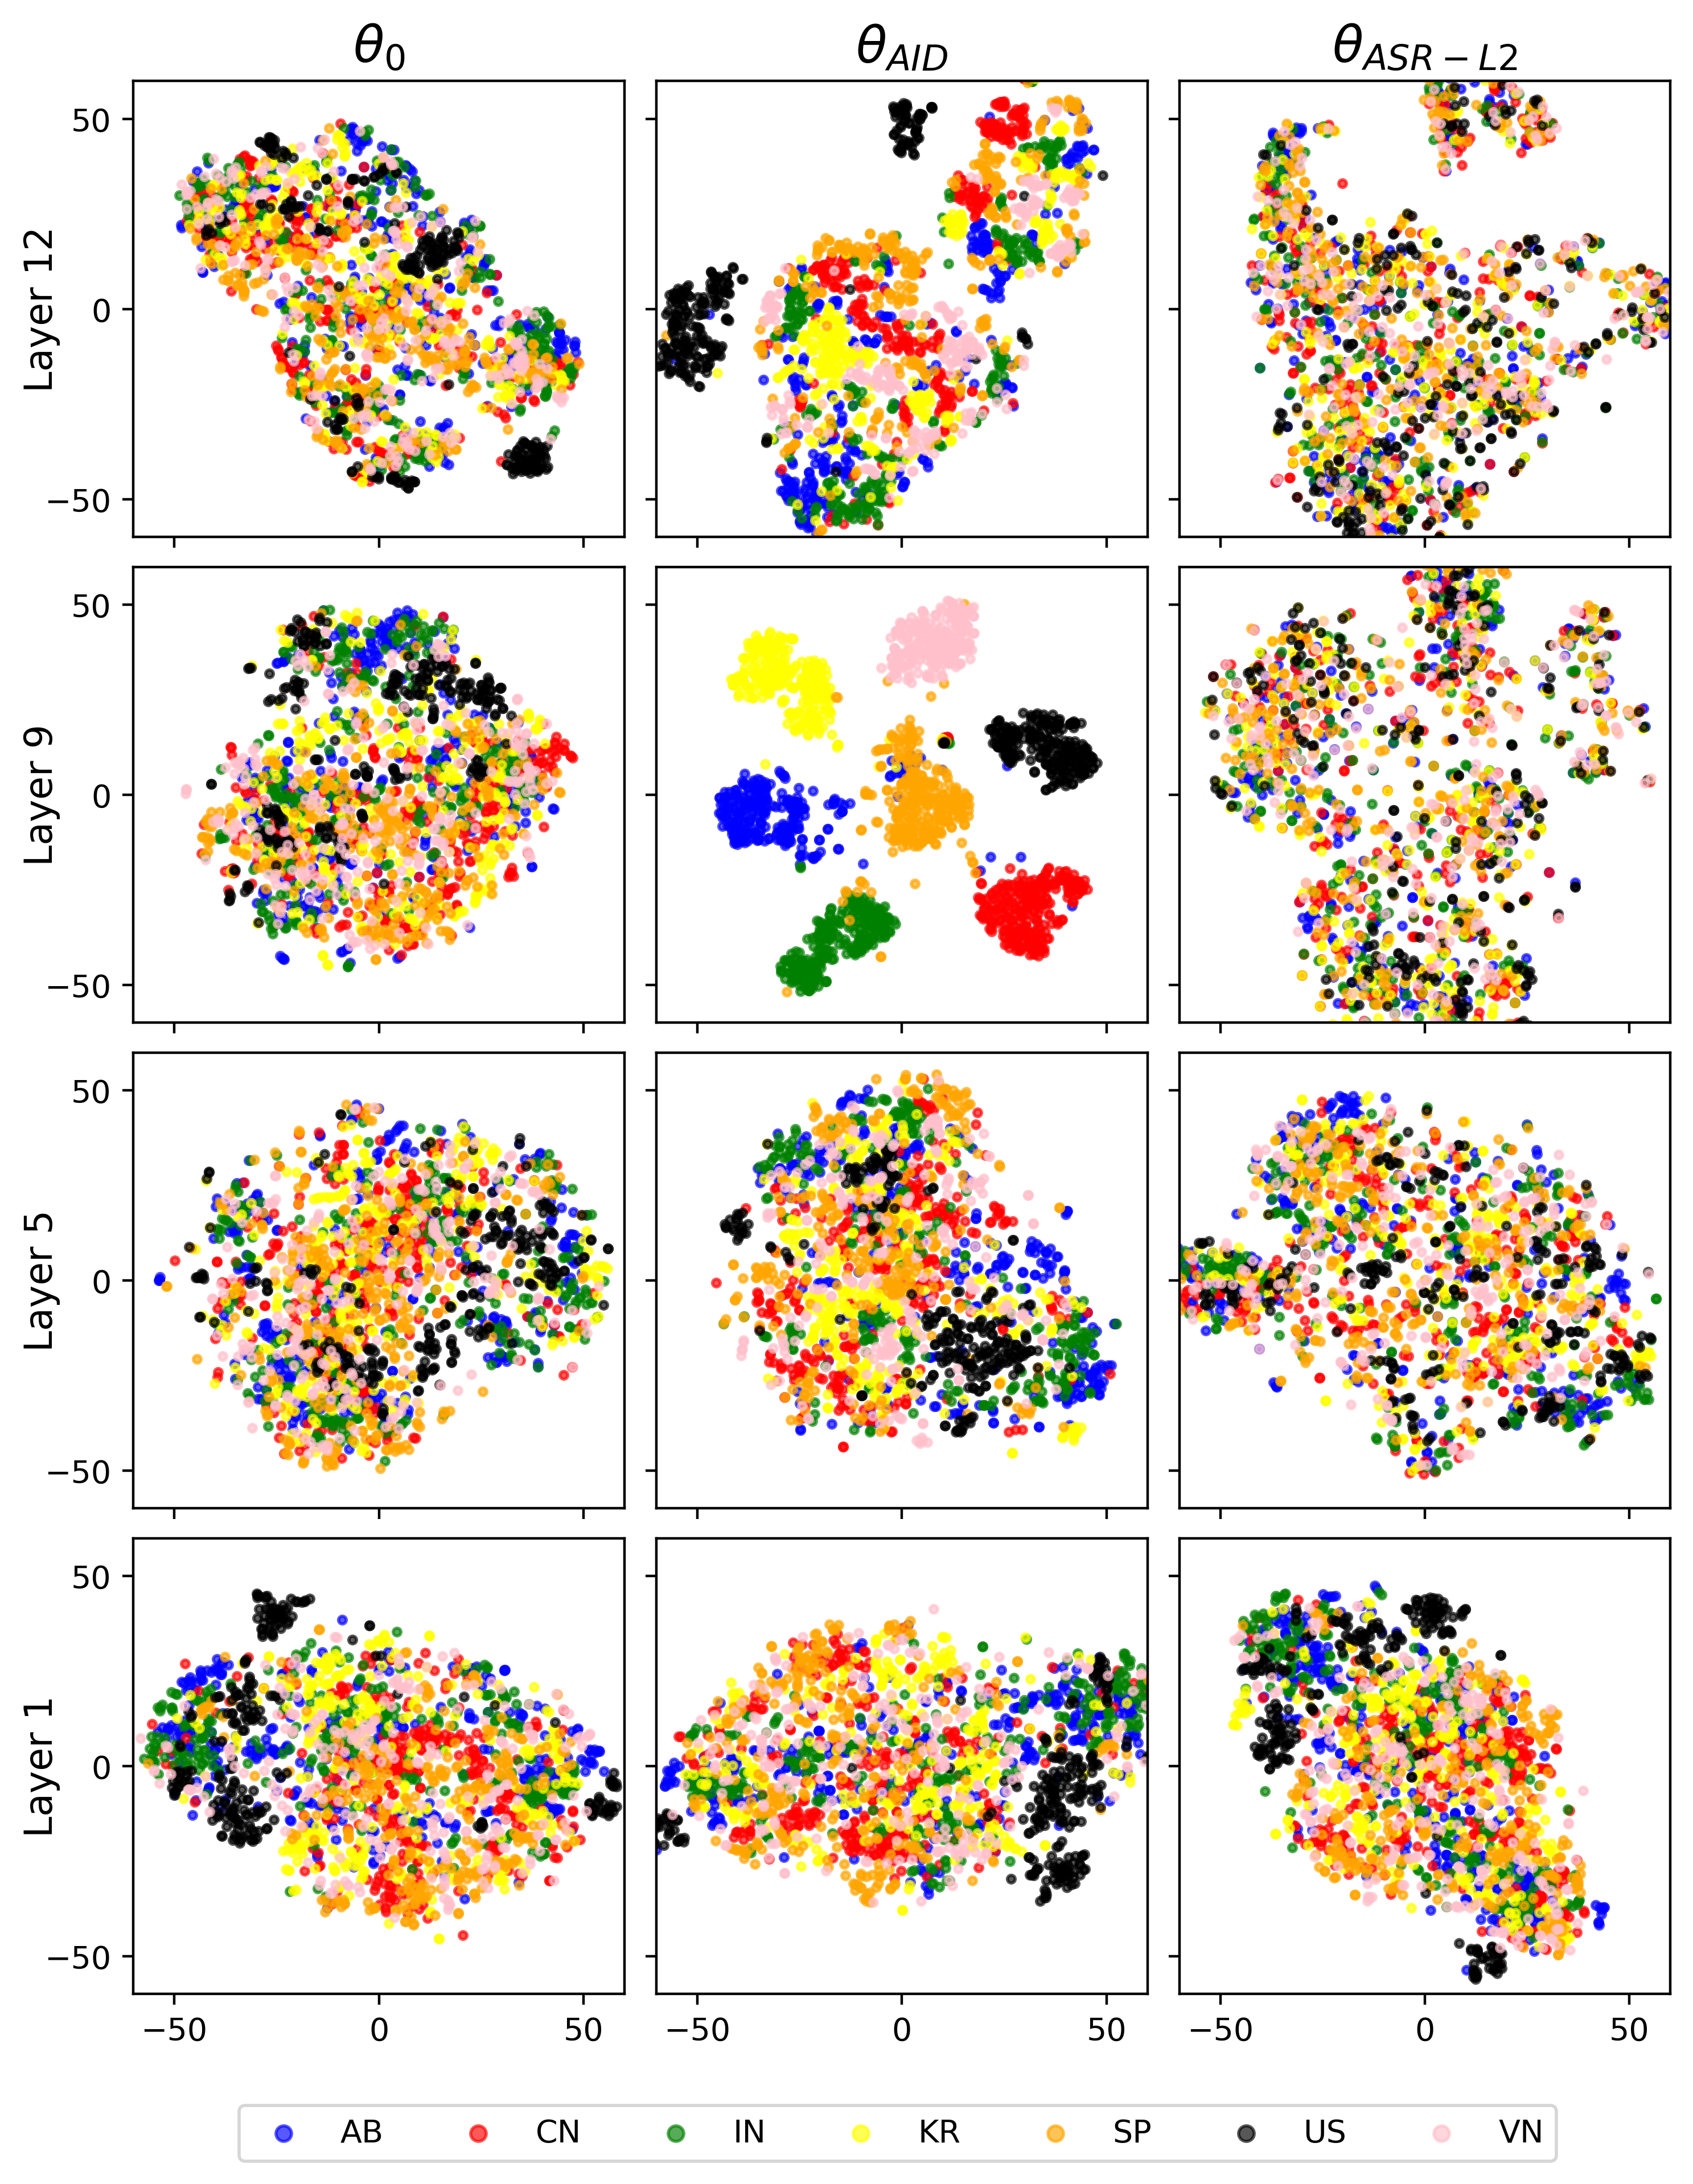
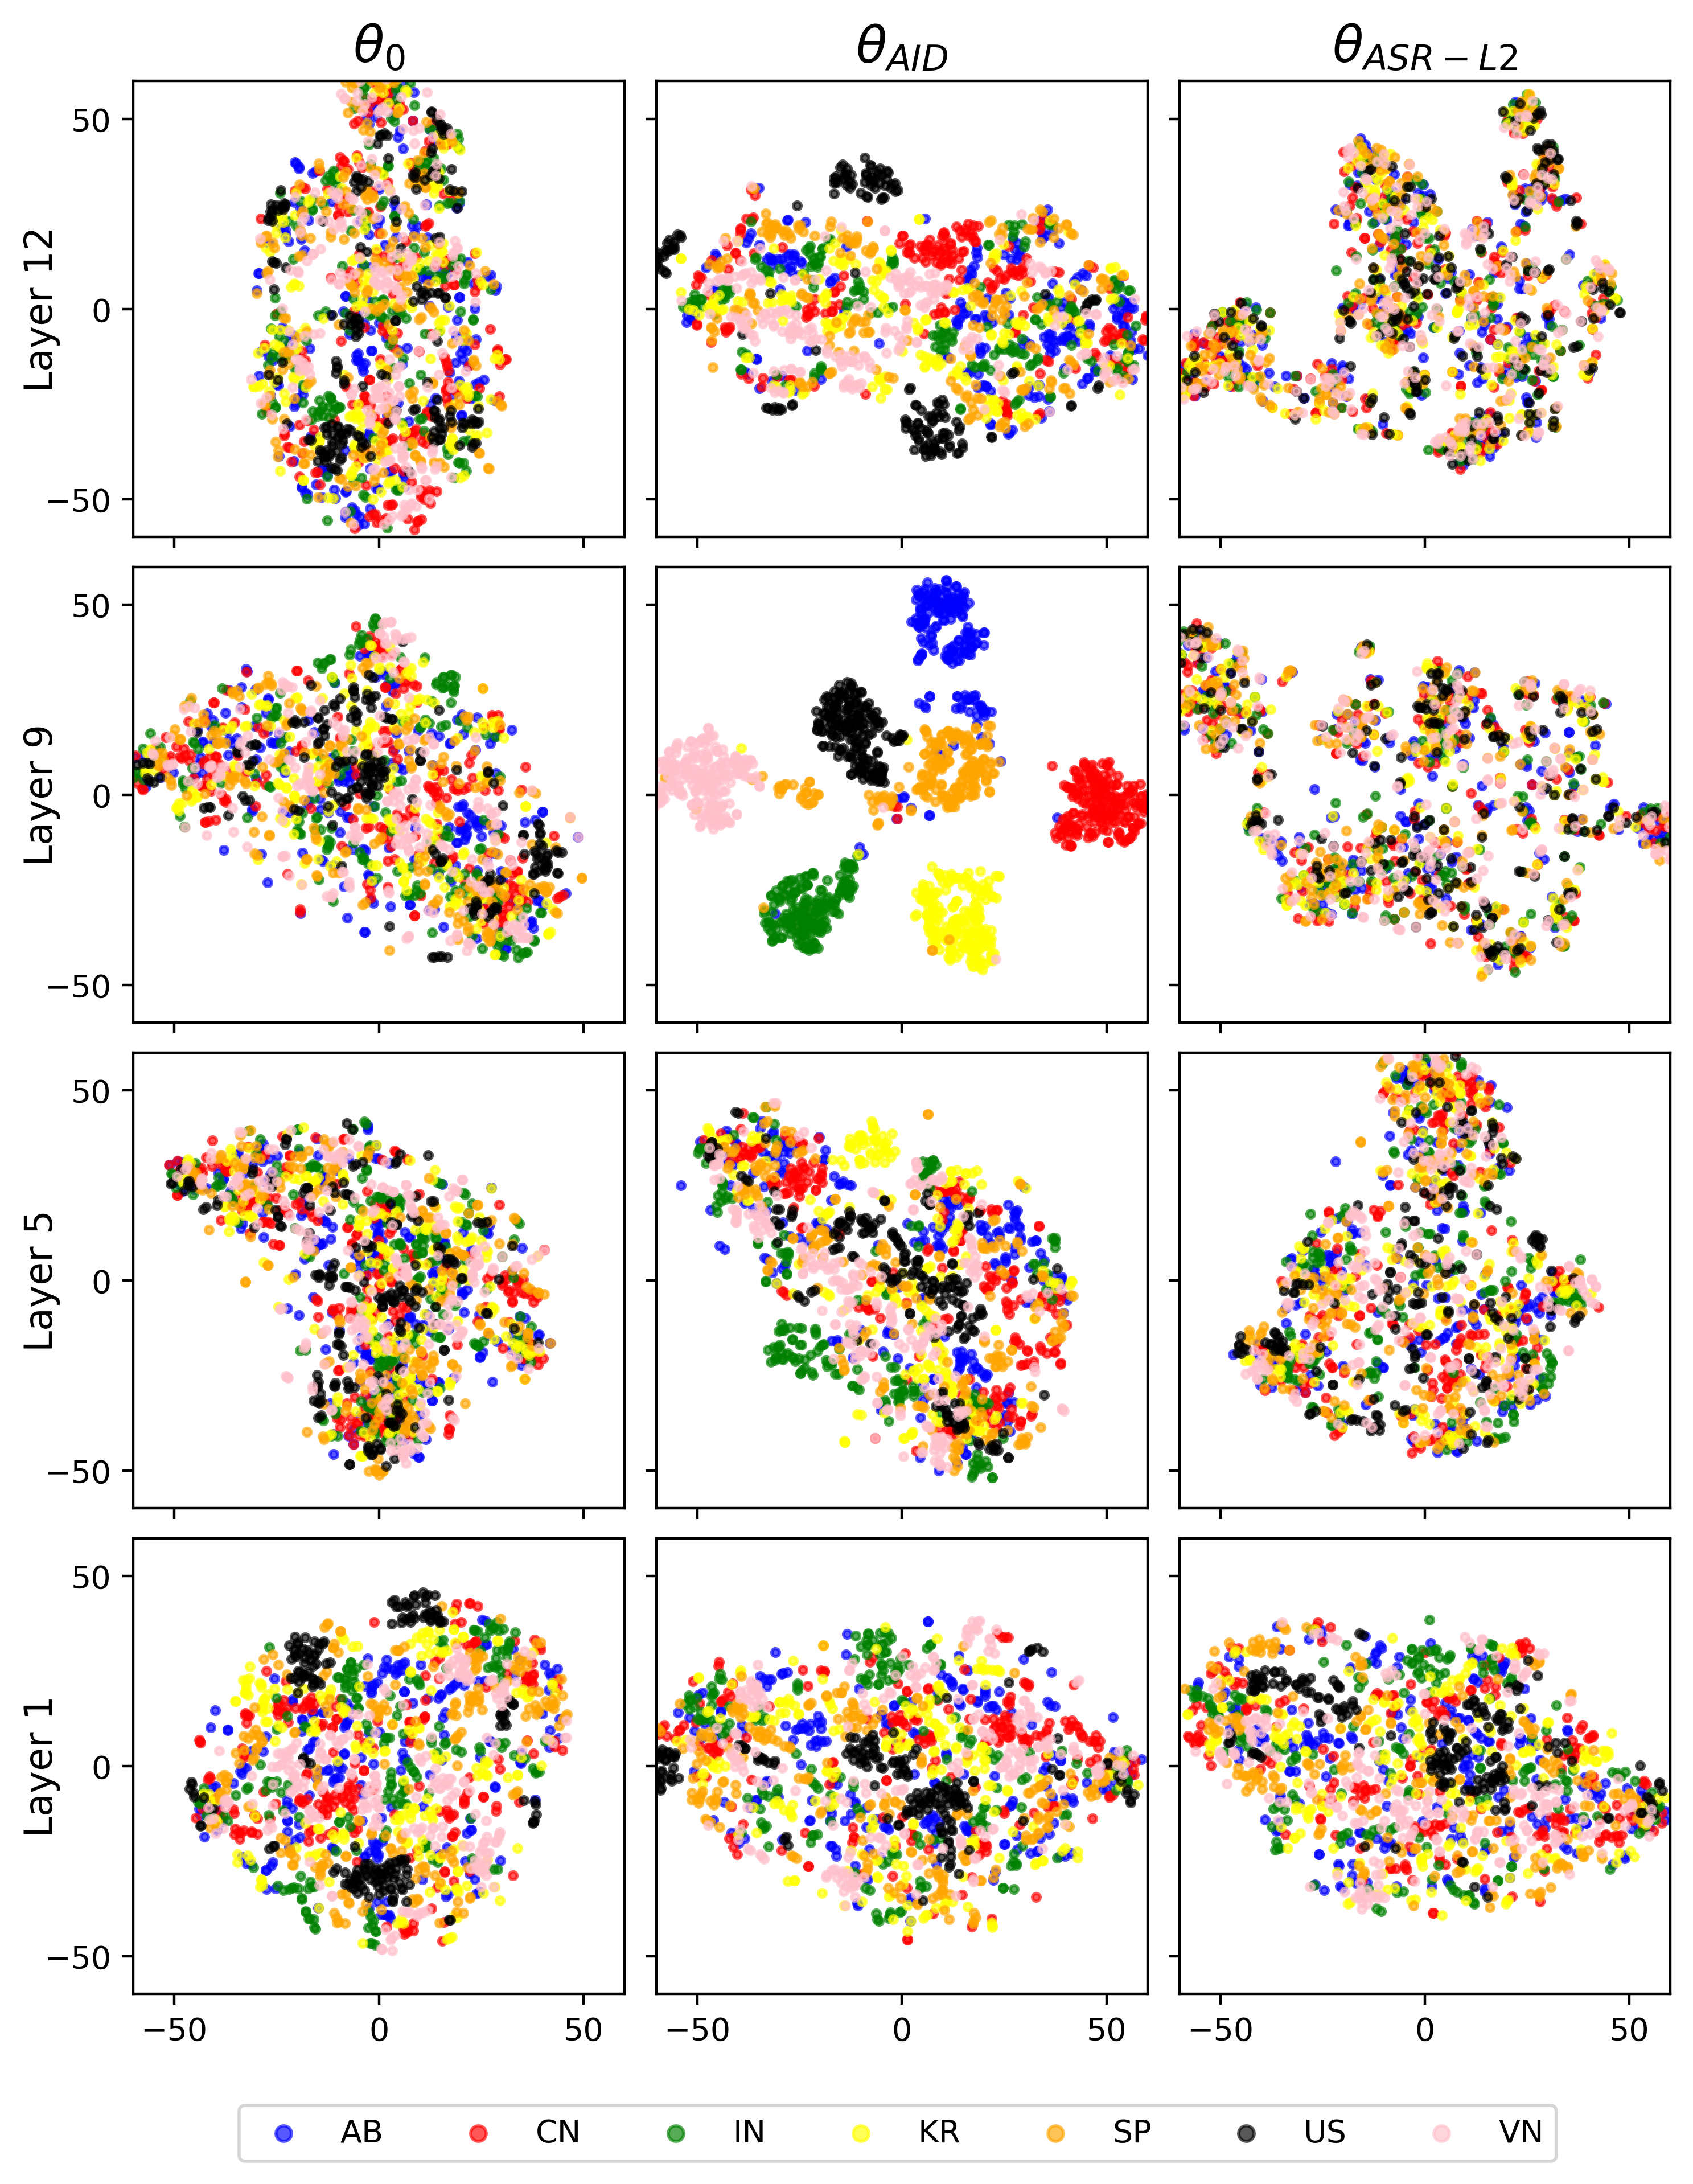
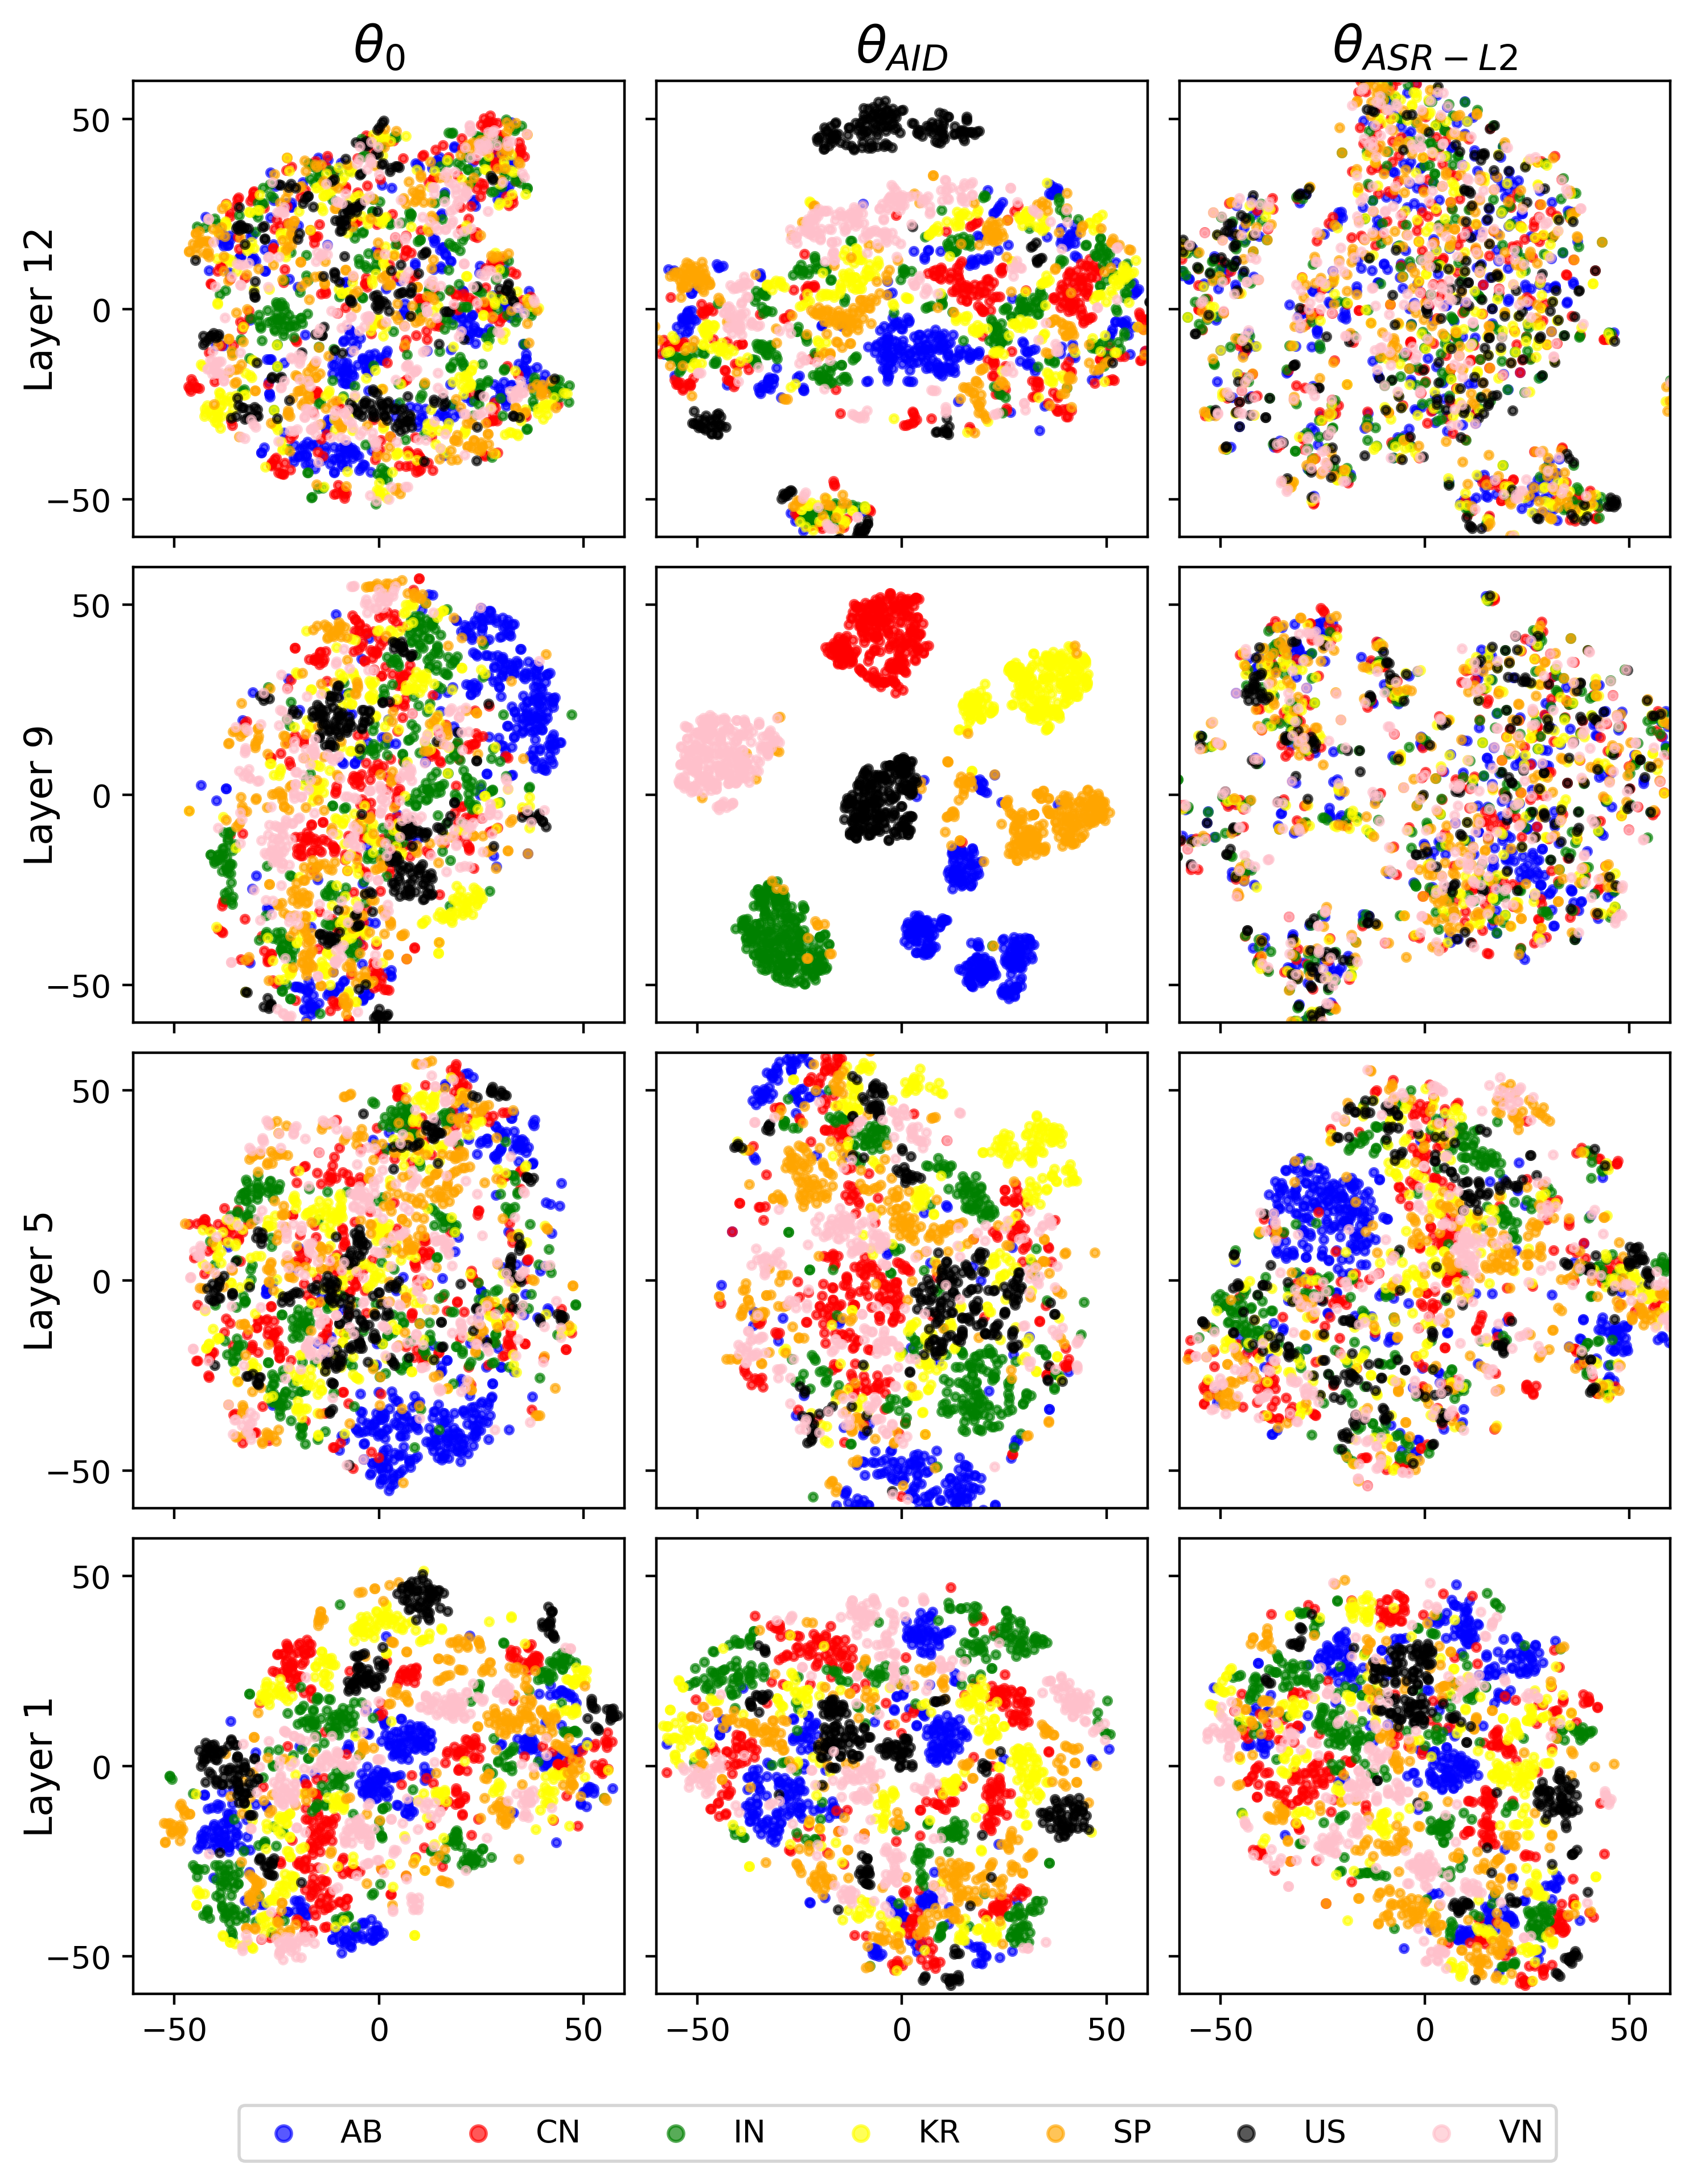
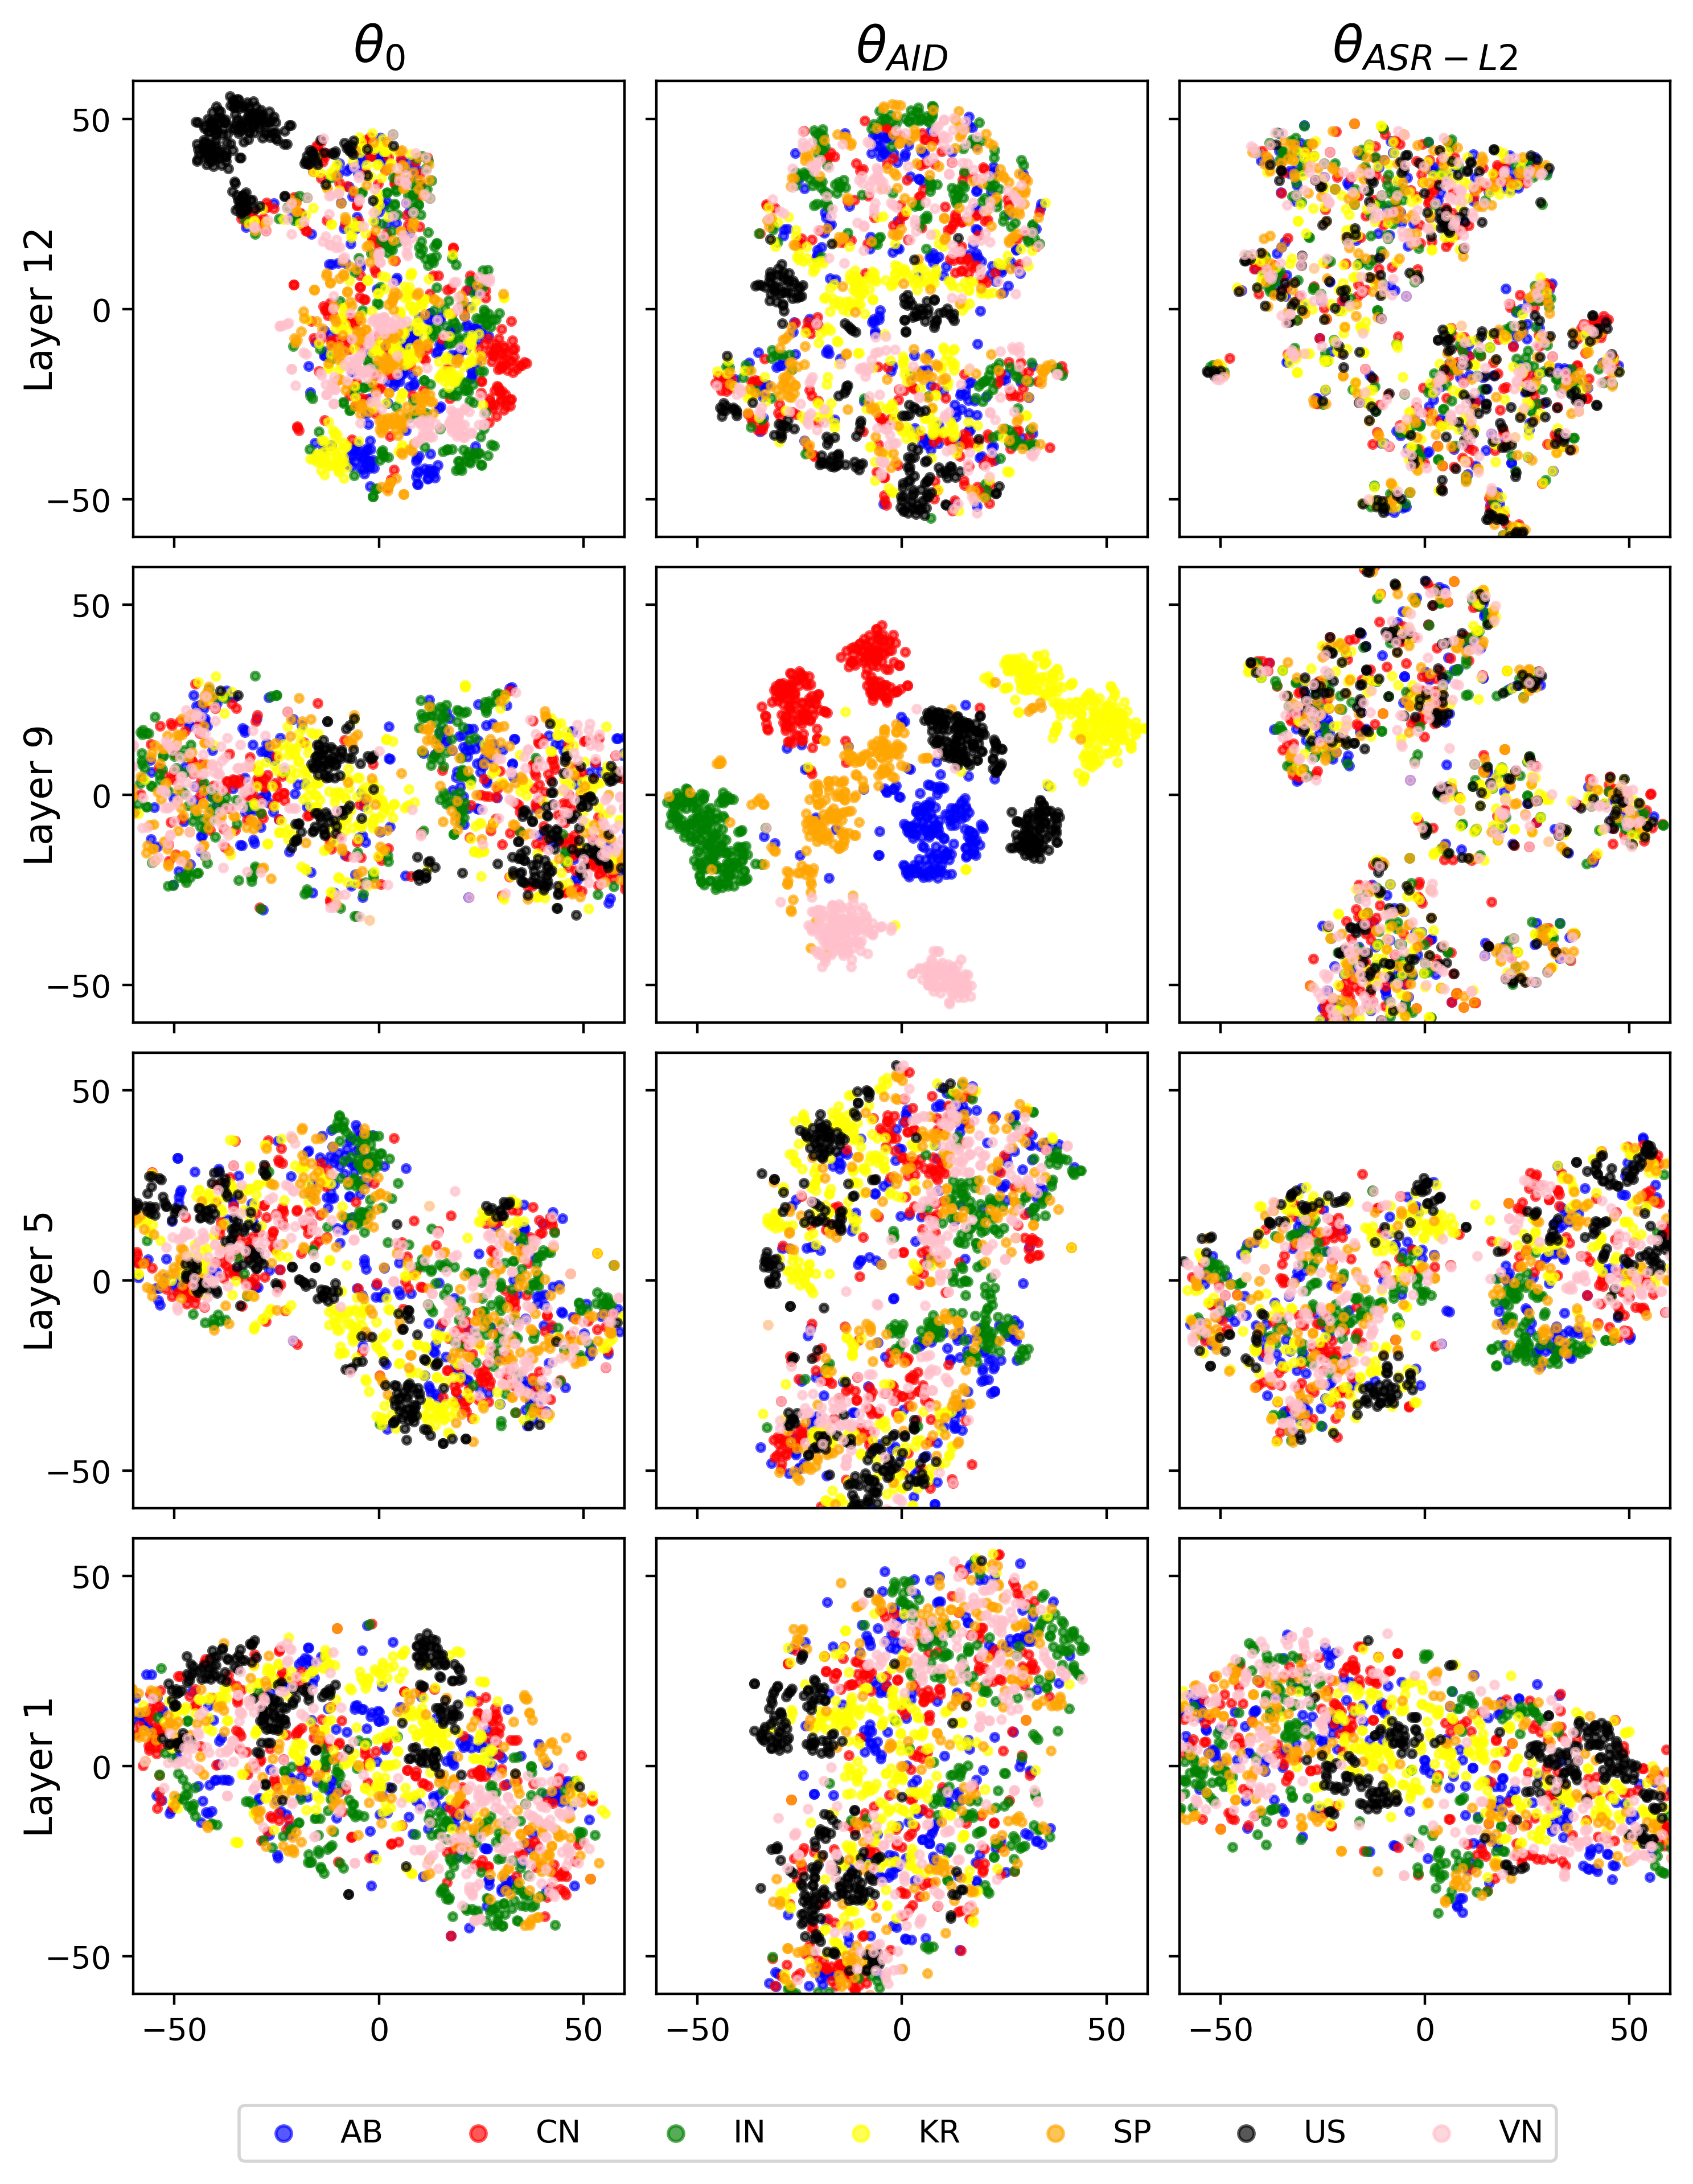
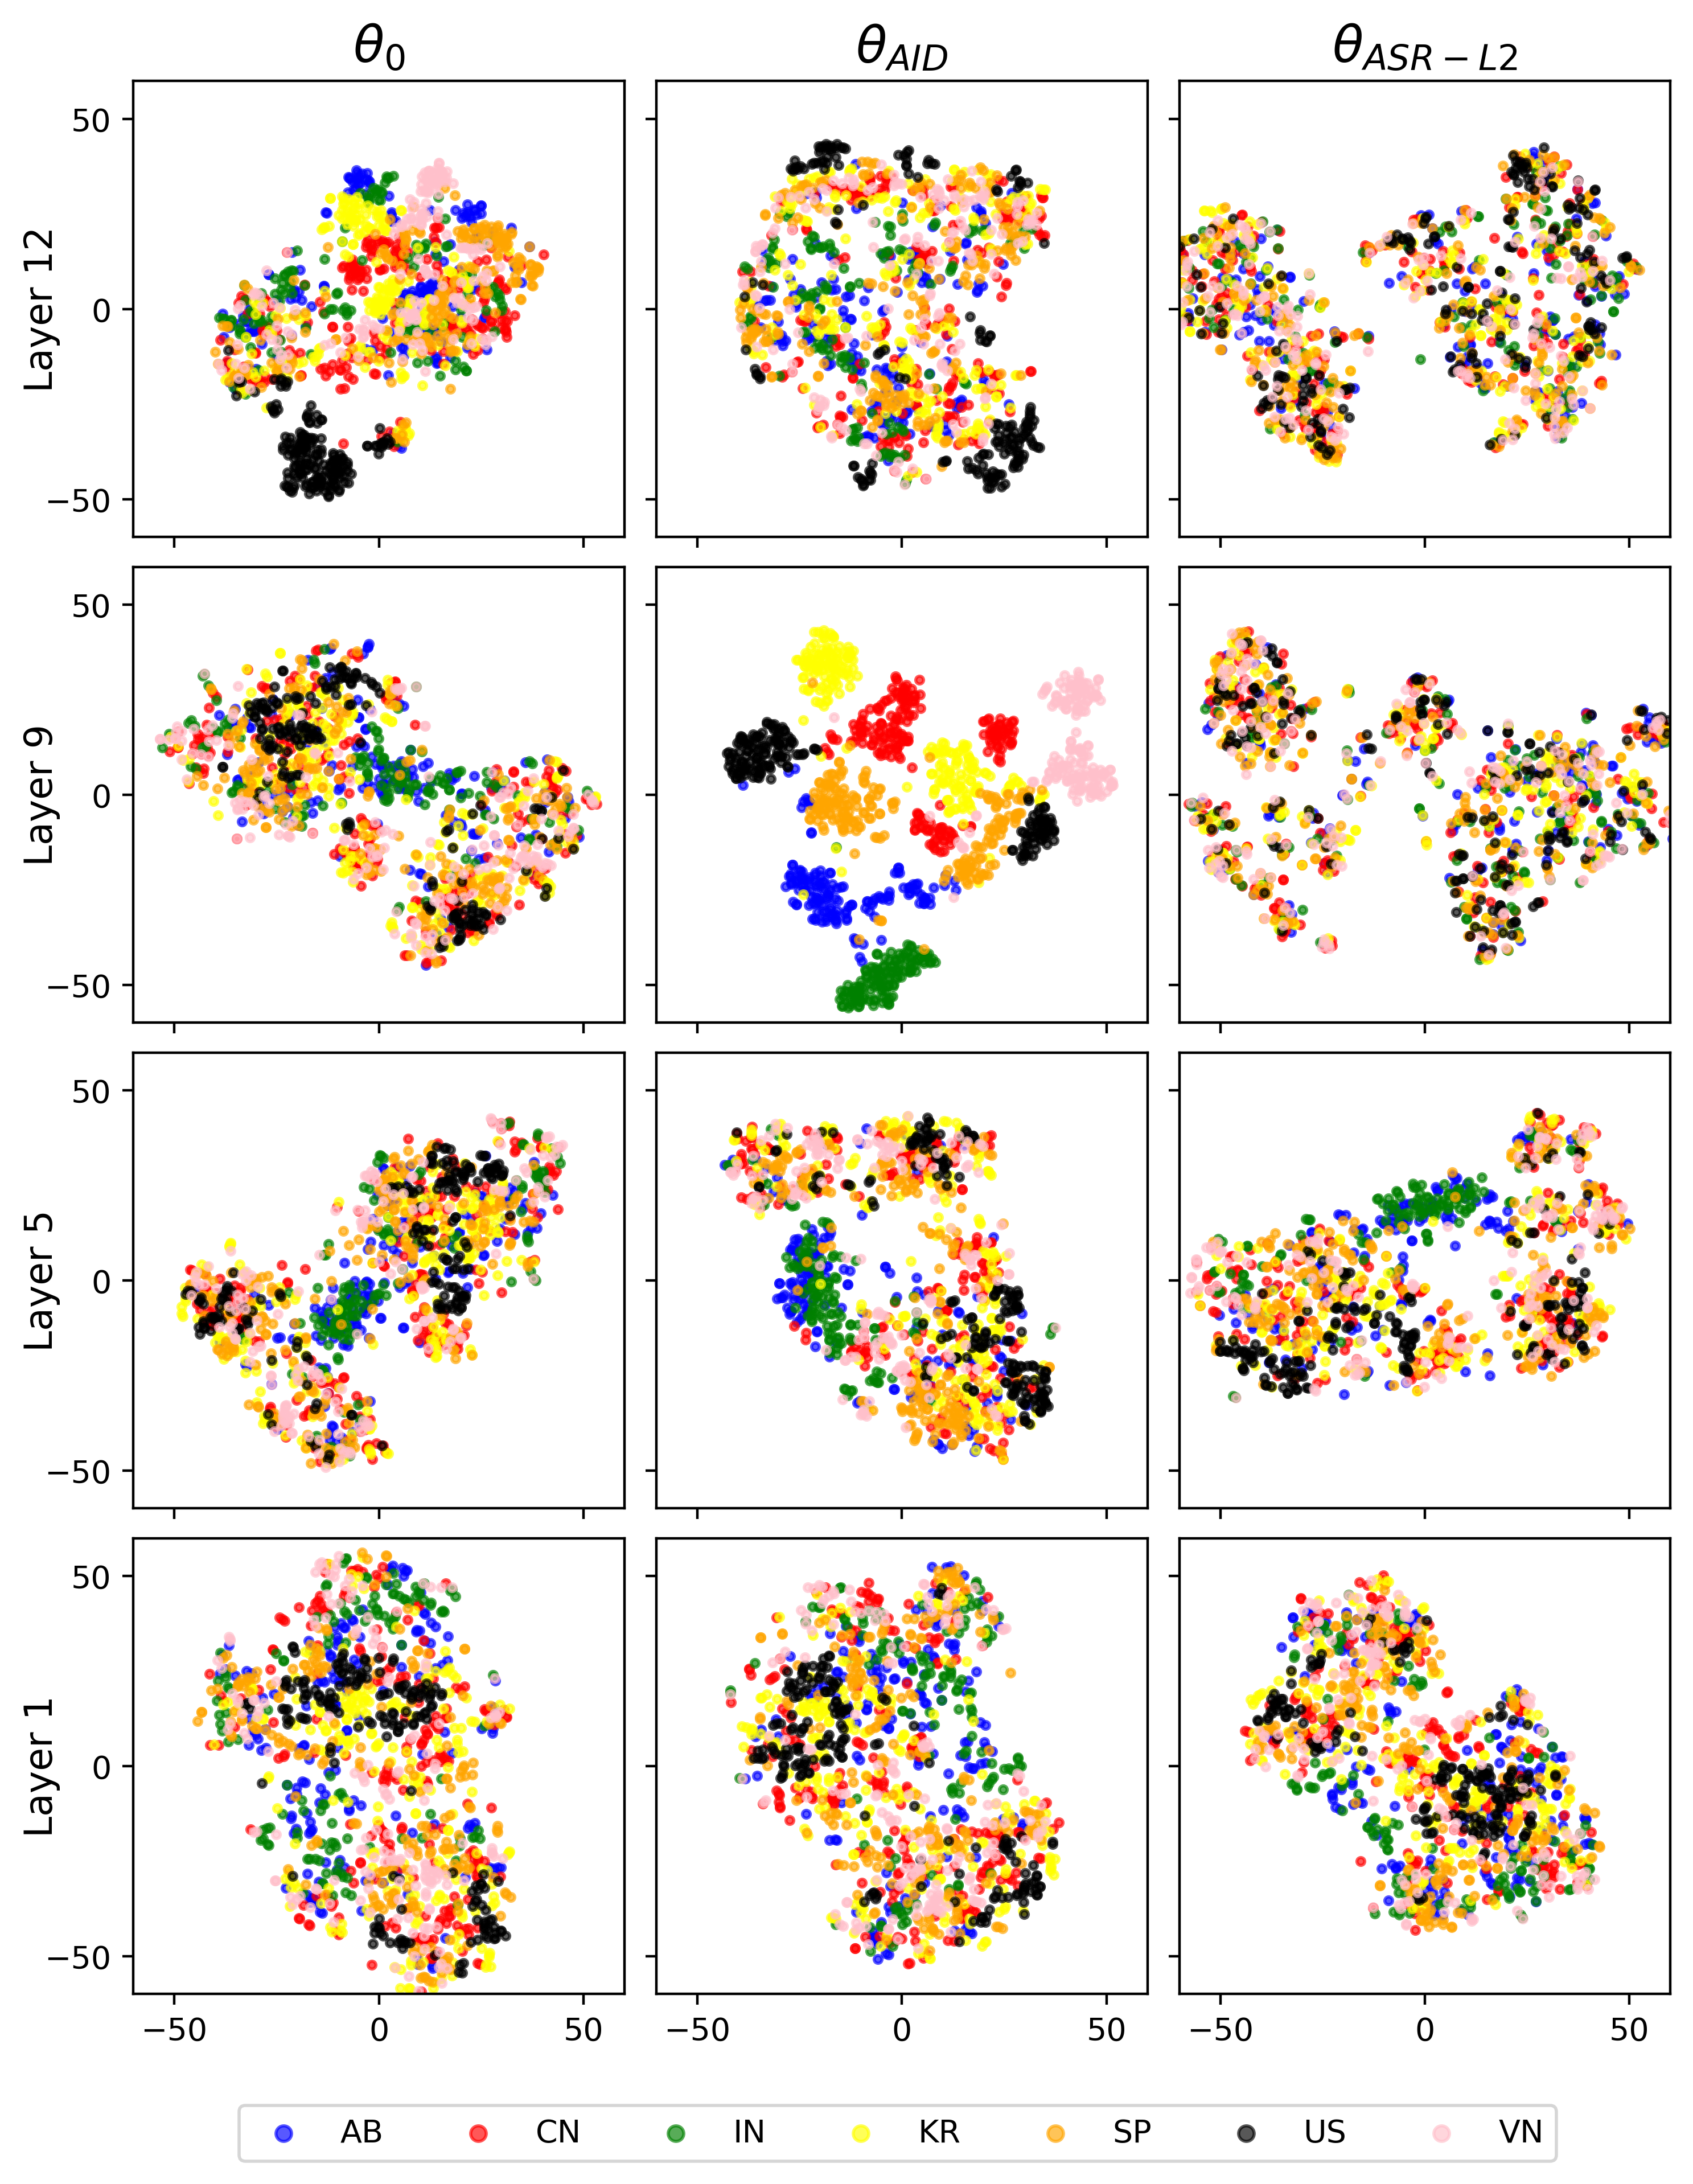
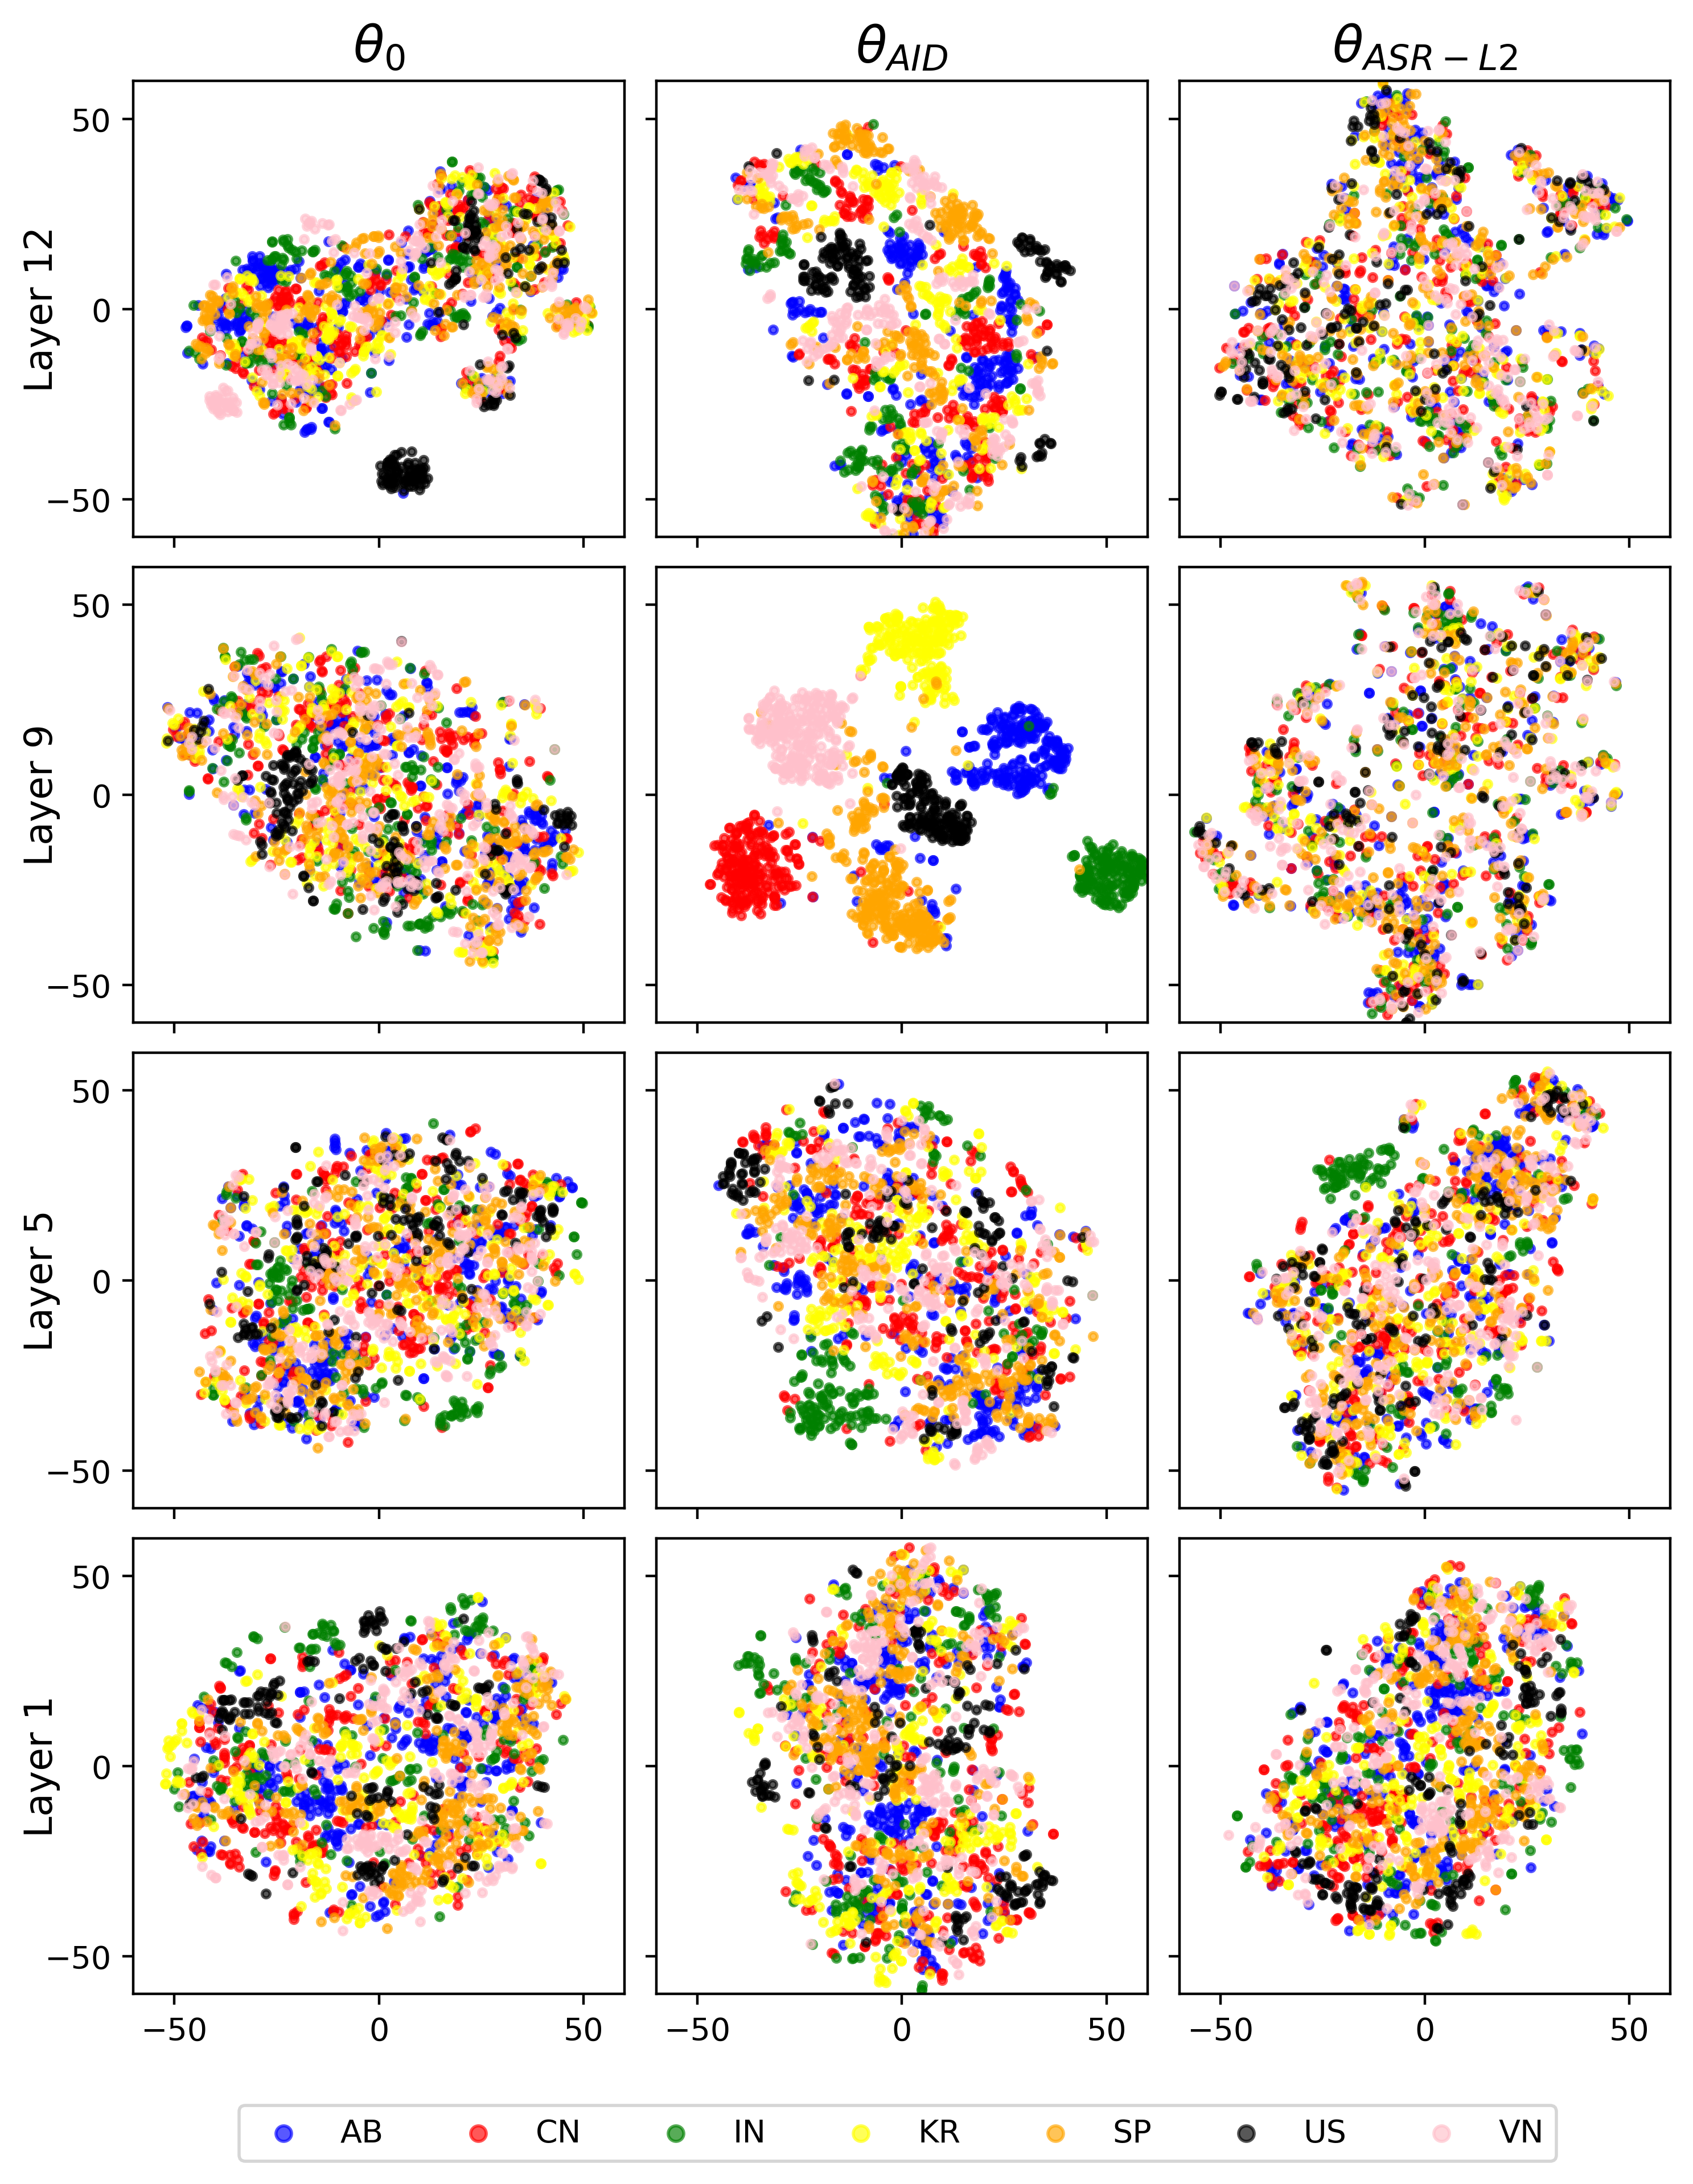
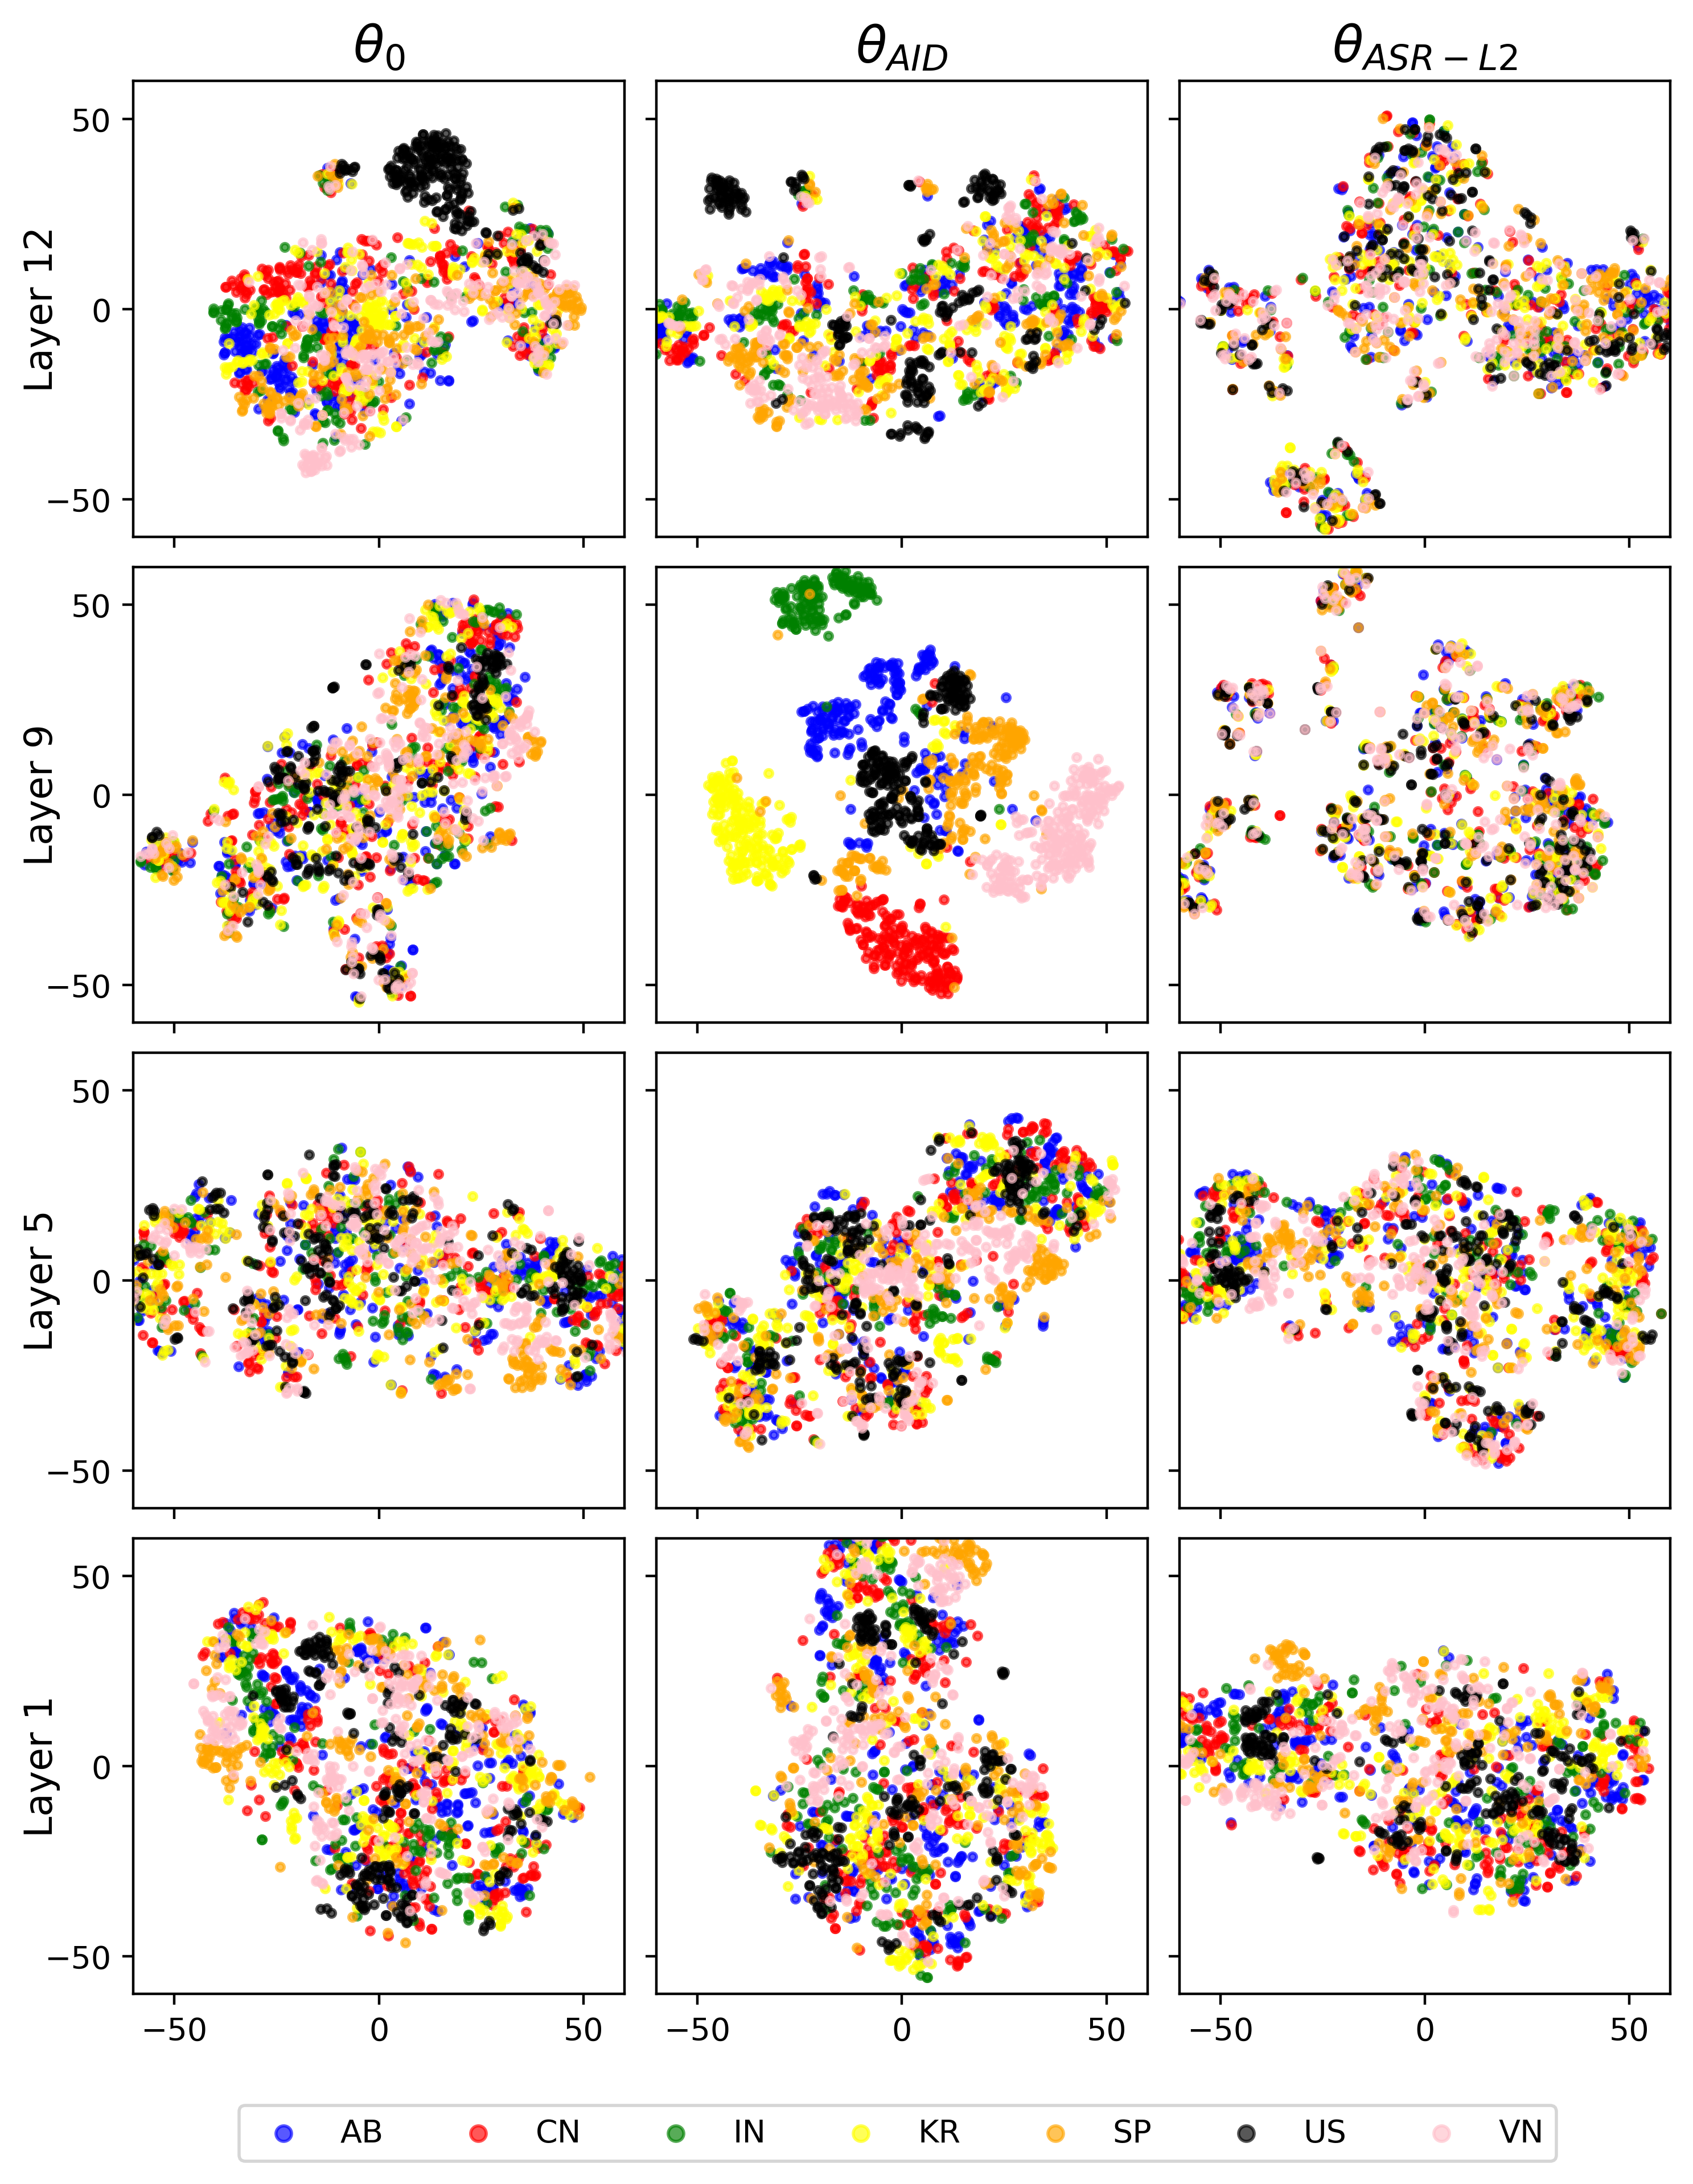
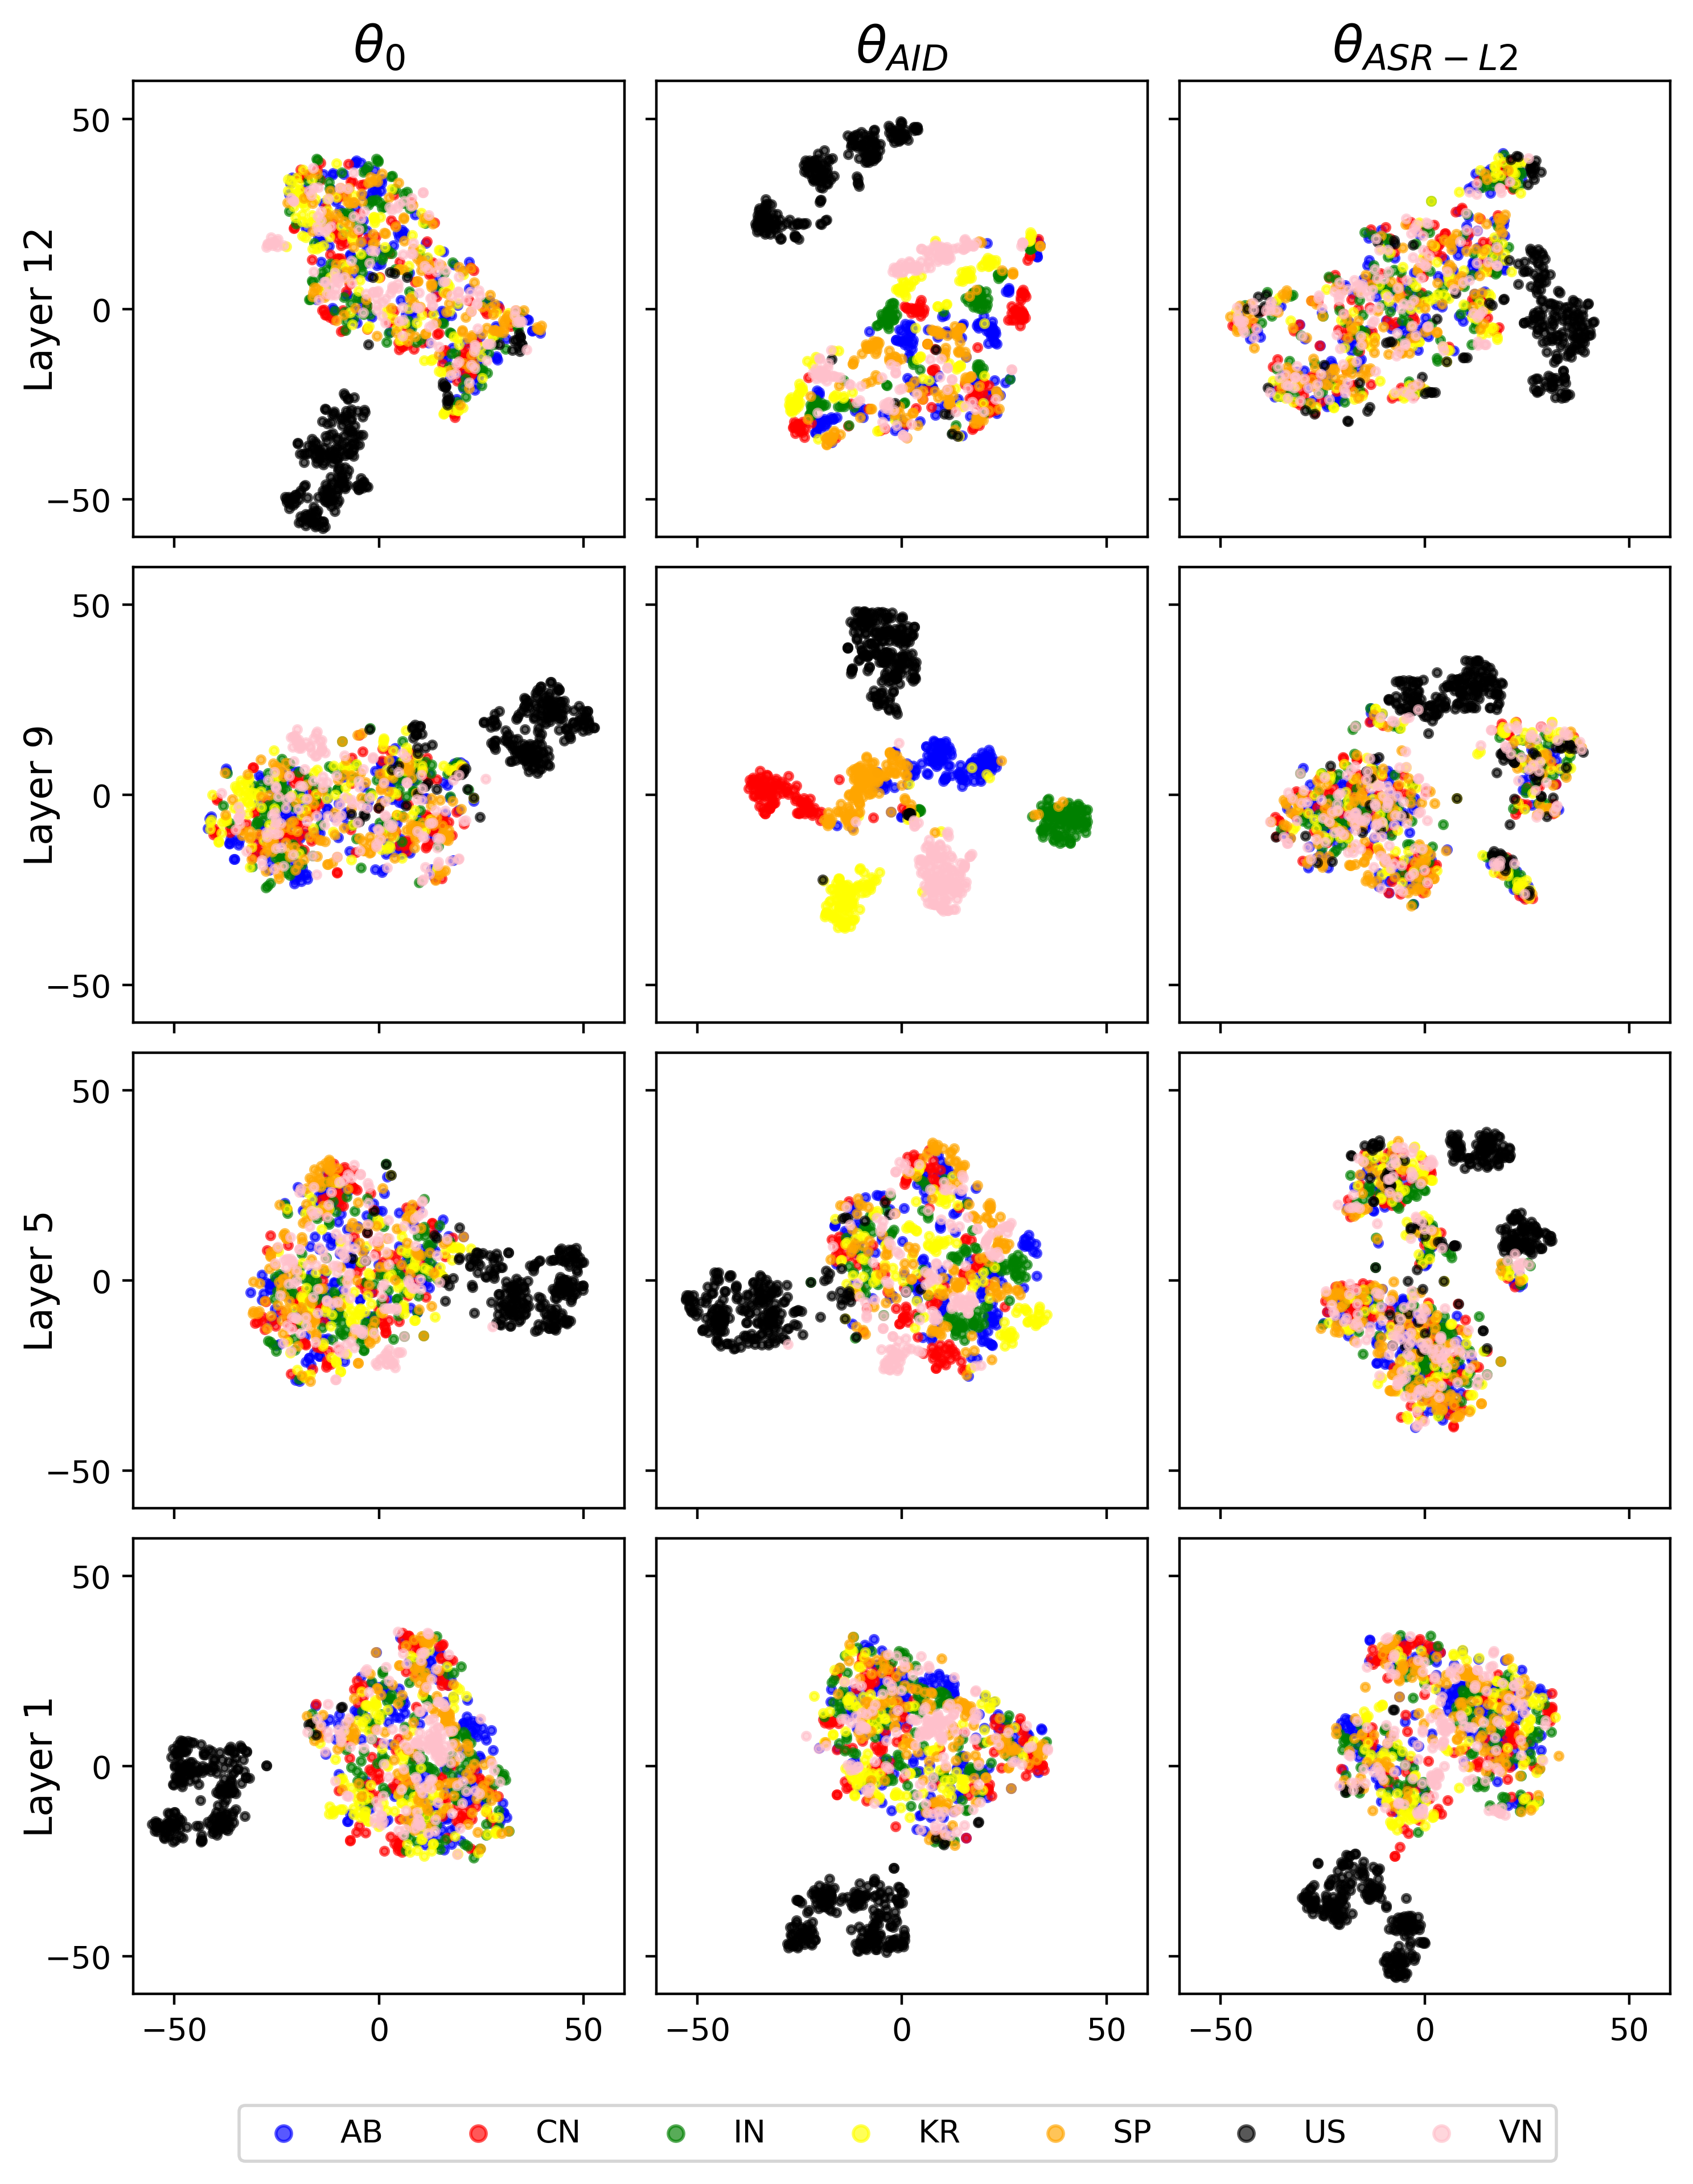
What Can an Accent Identifier Learn? Probing Phonetic and Prosodic Information in a Wav2vec2-based Accent Identification ModelMu Yang1, Ram C. M. C. Shekar1, Okim Kang2, John H. L. Hansen11Center for Robust Speech Systems (CRSS), University of Texas at Dallas, USA2Northern Arizona University, USA |
(Click on the buttons to toggle the figure)
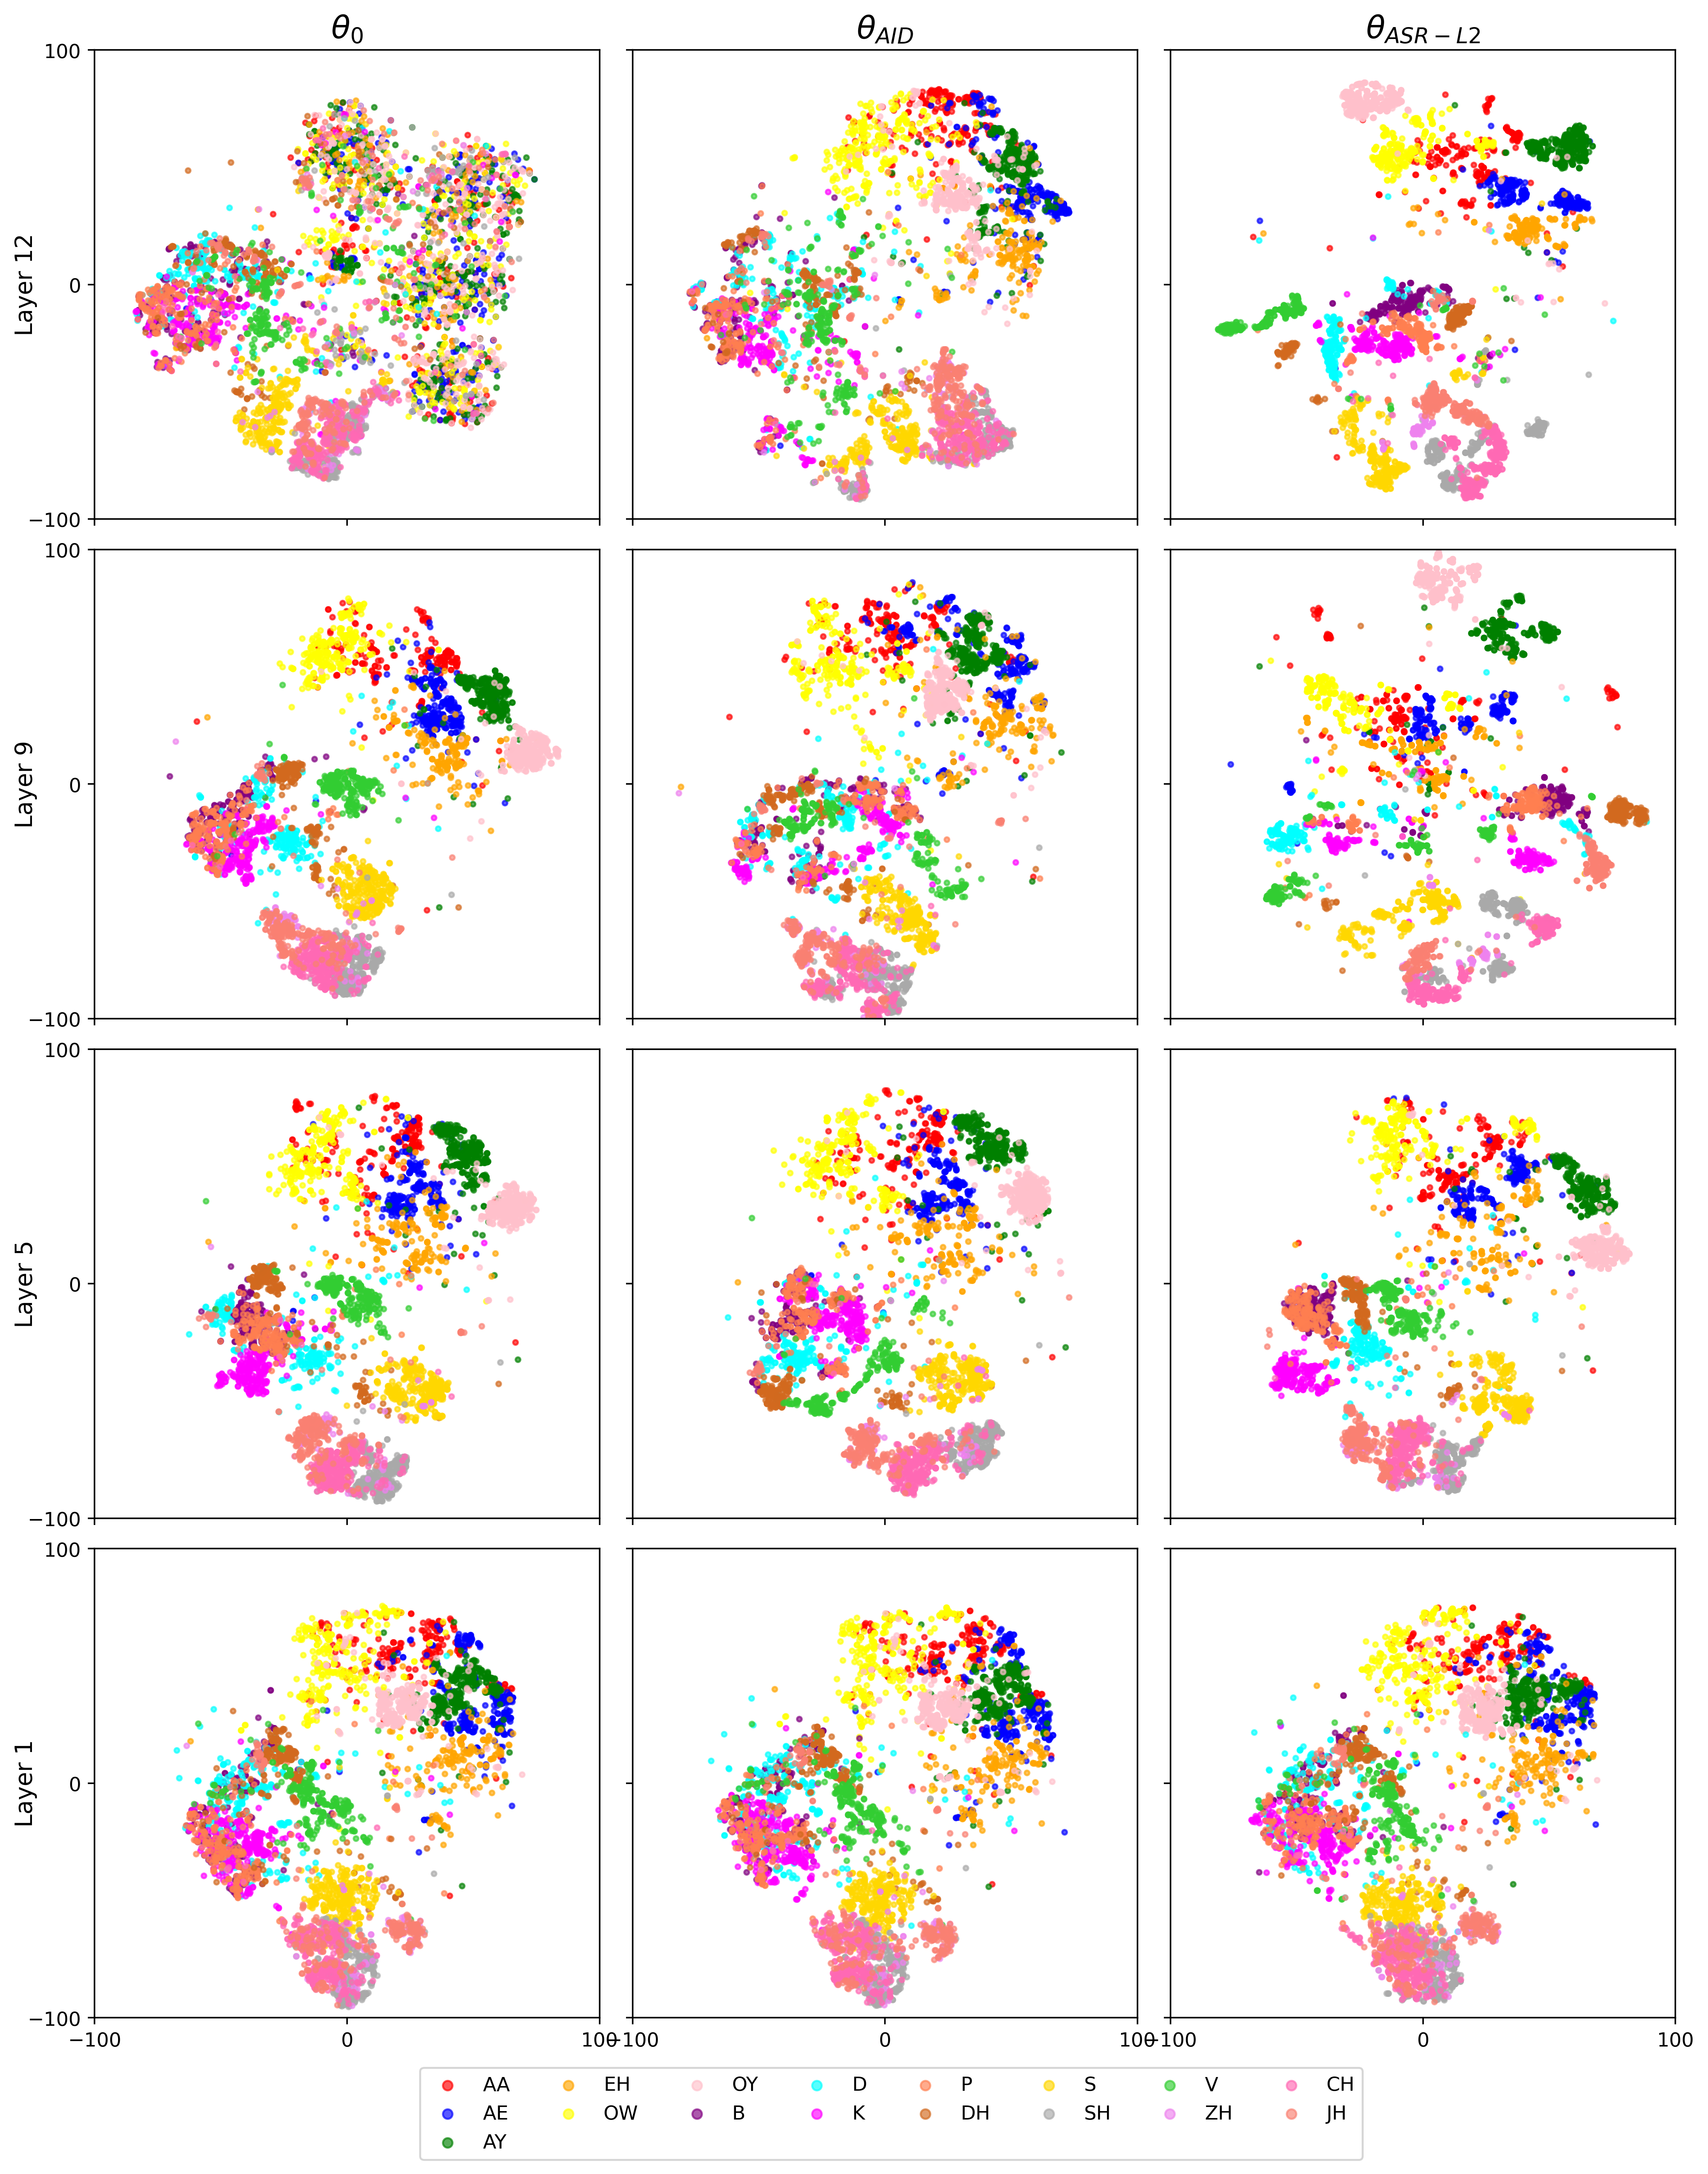
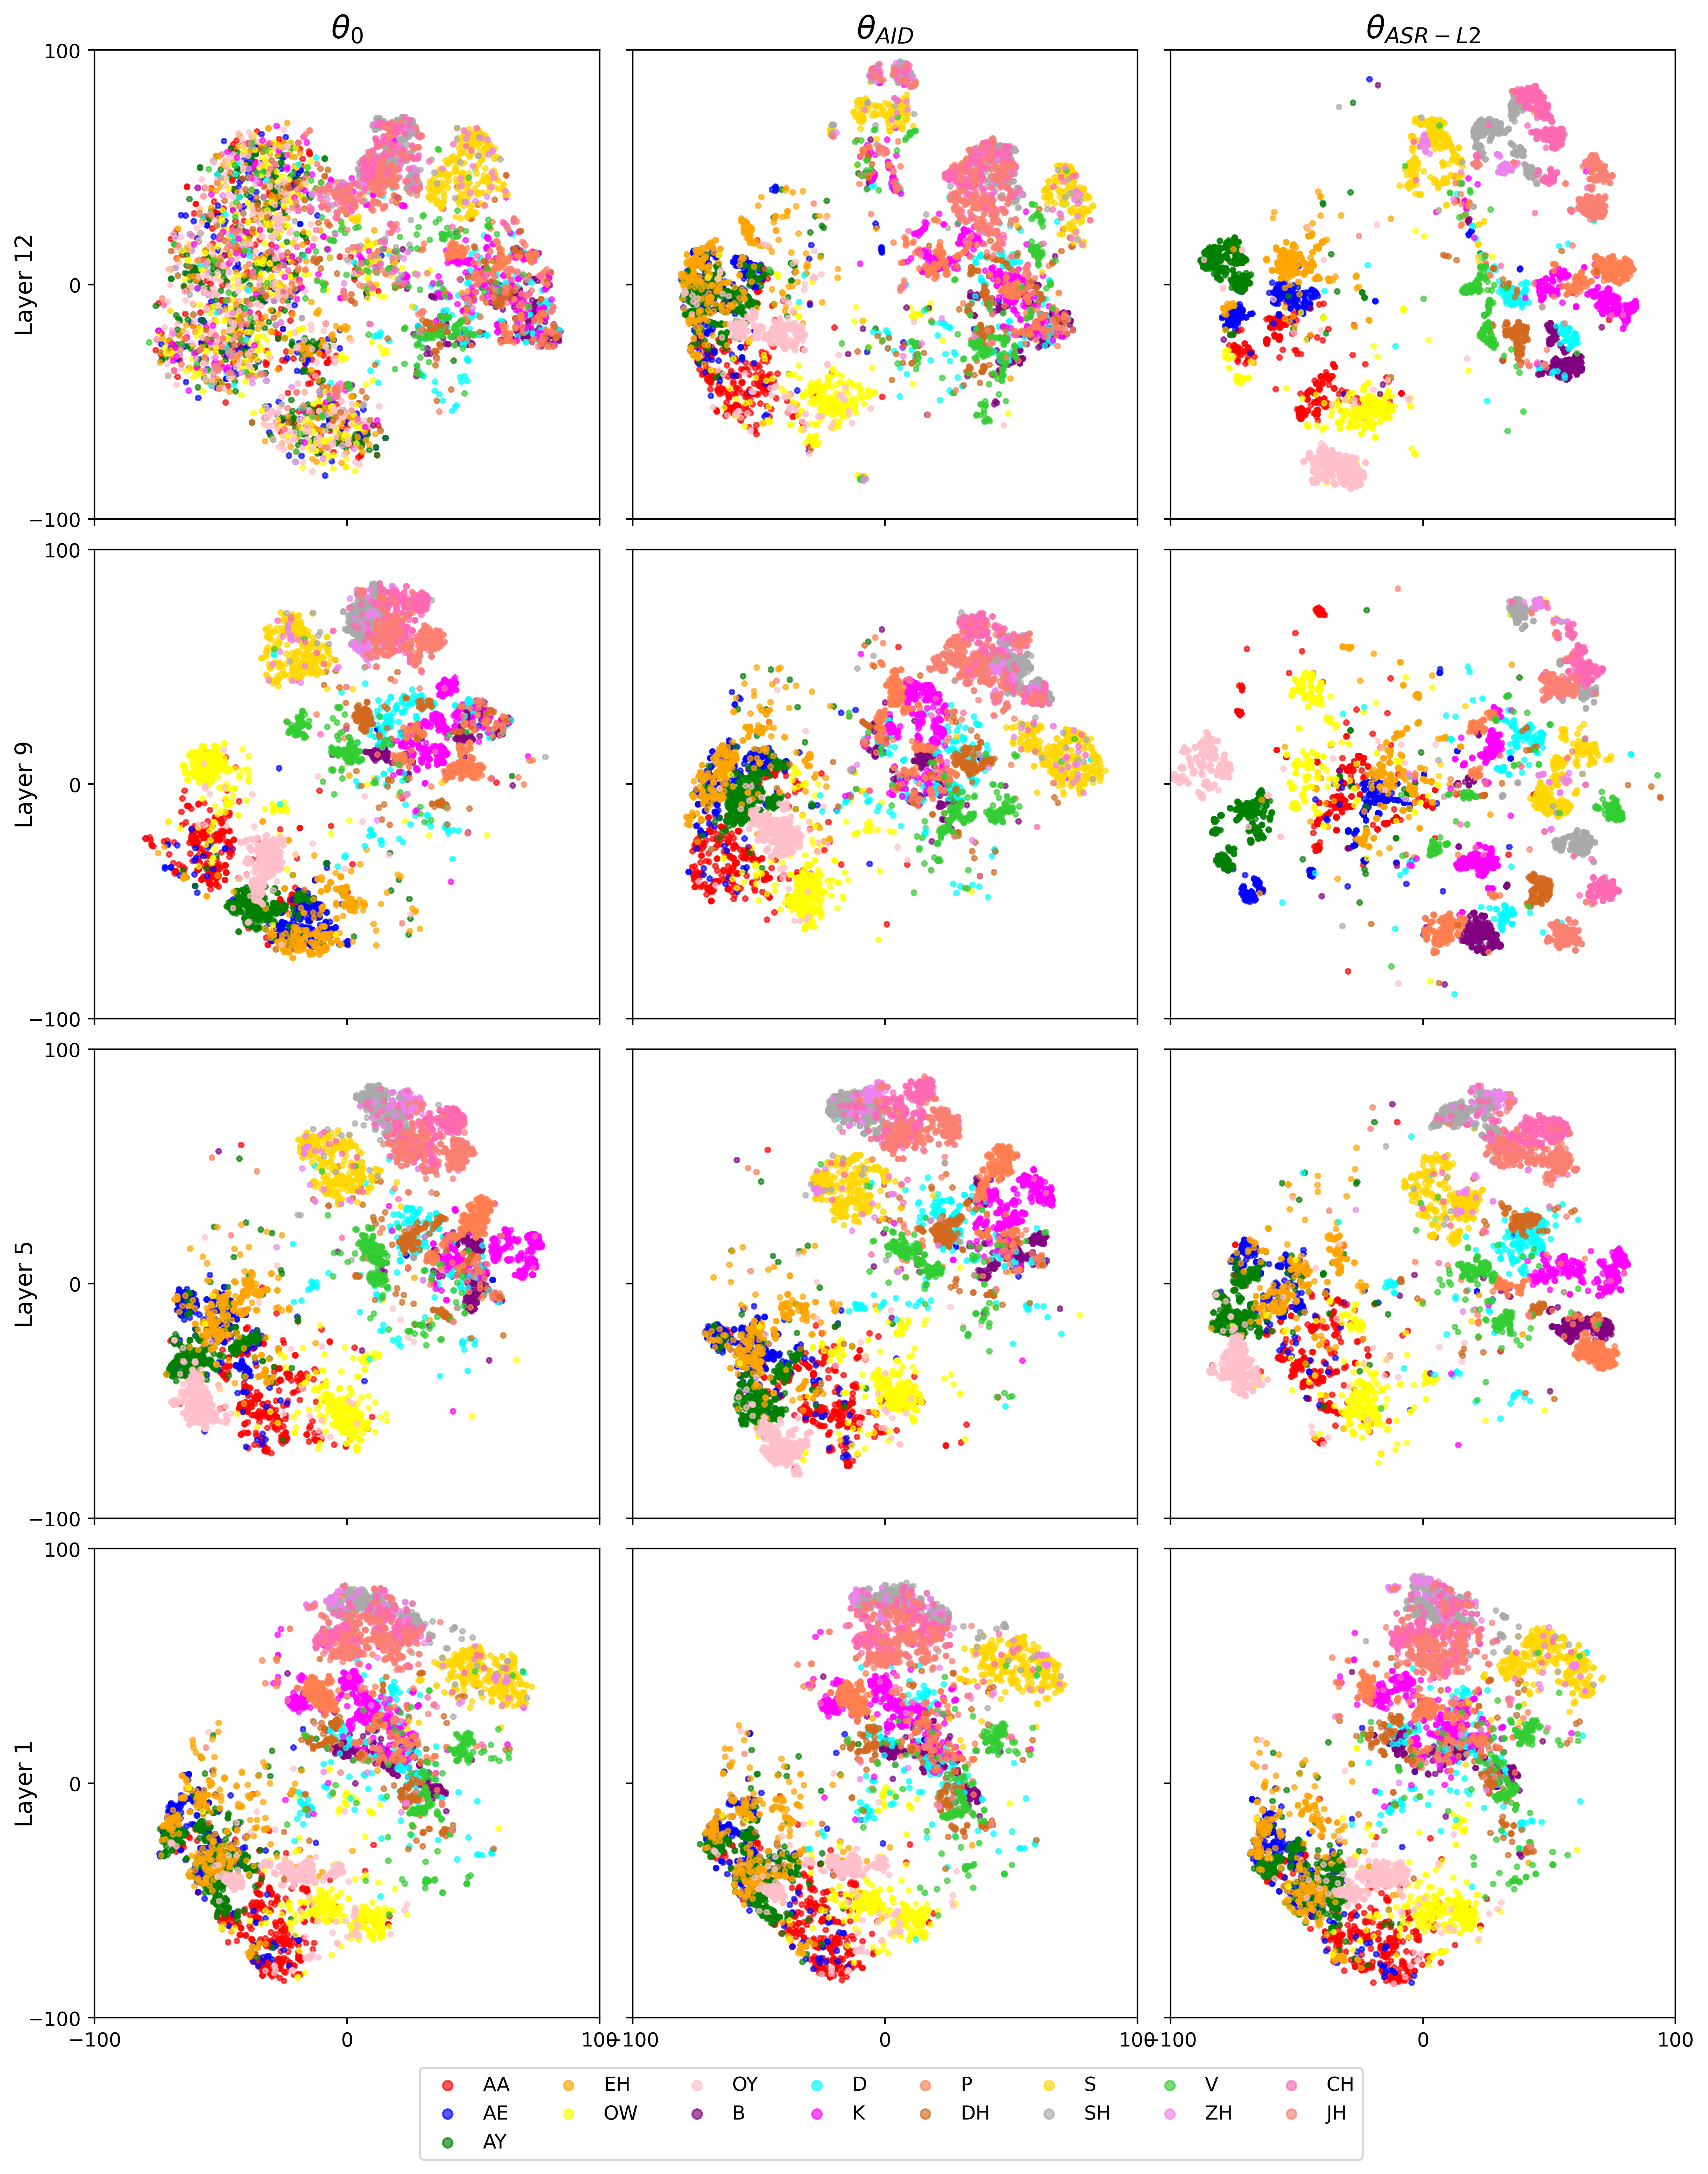
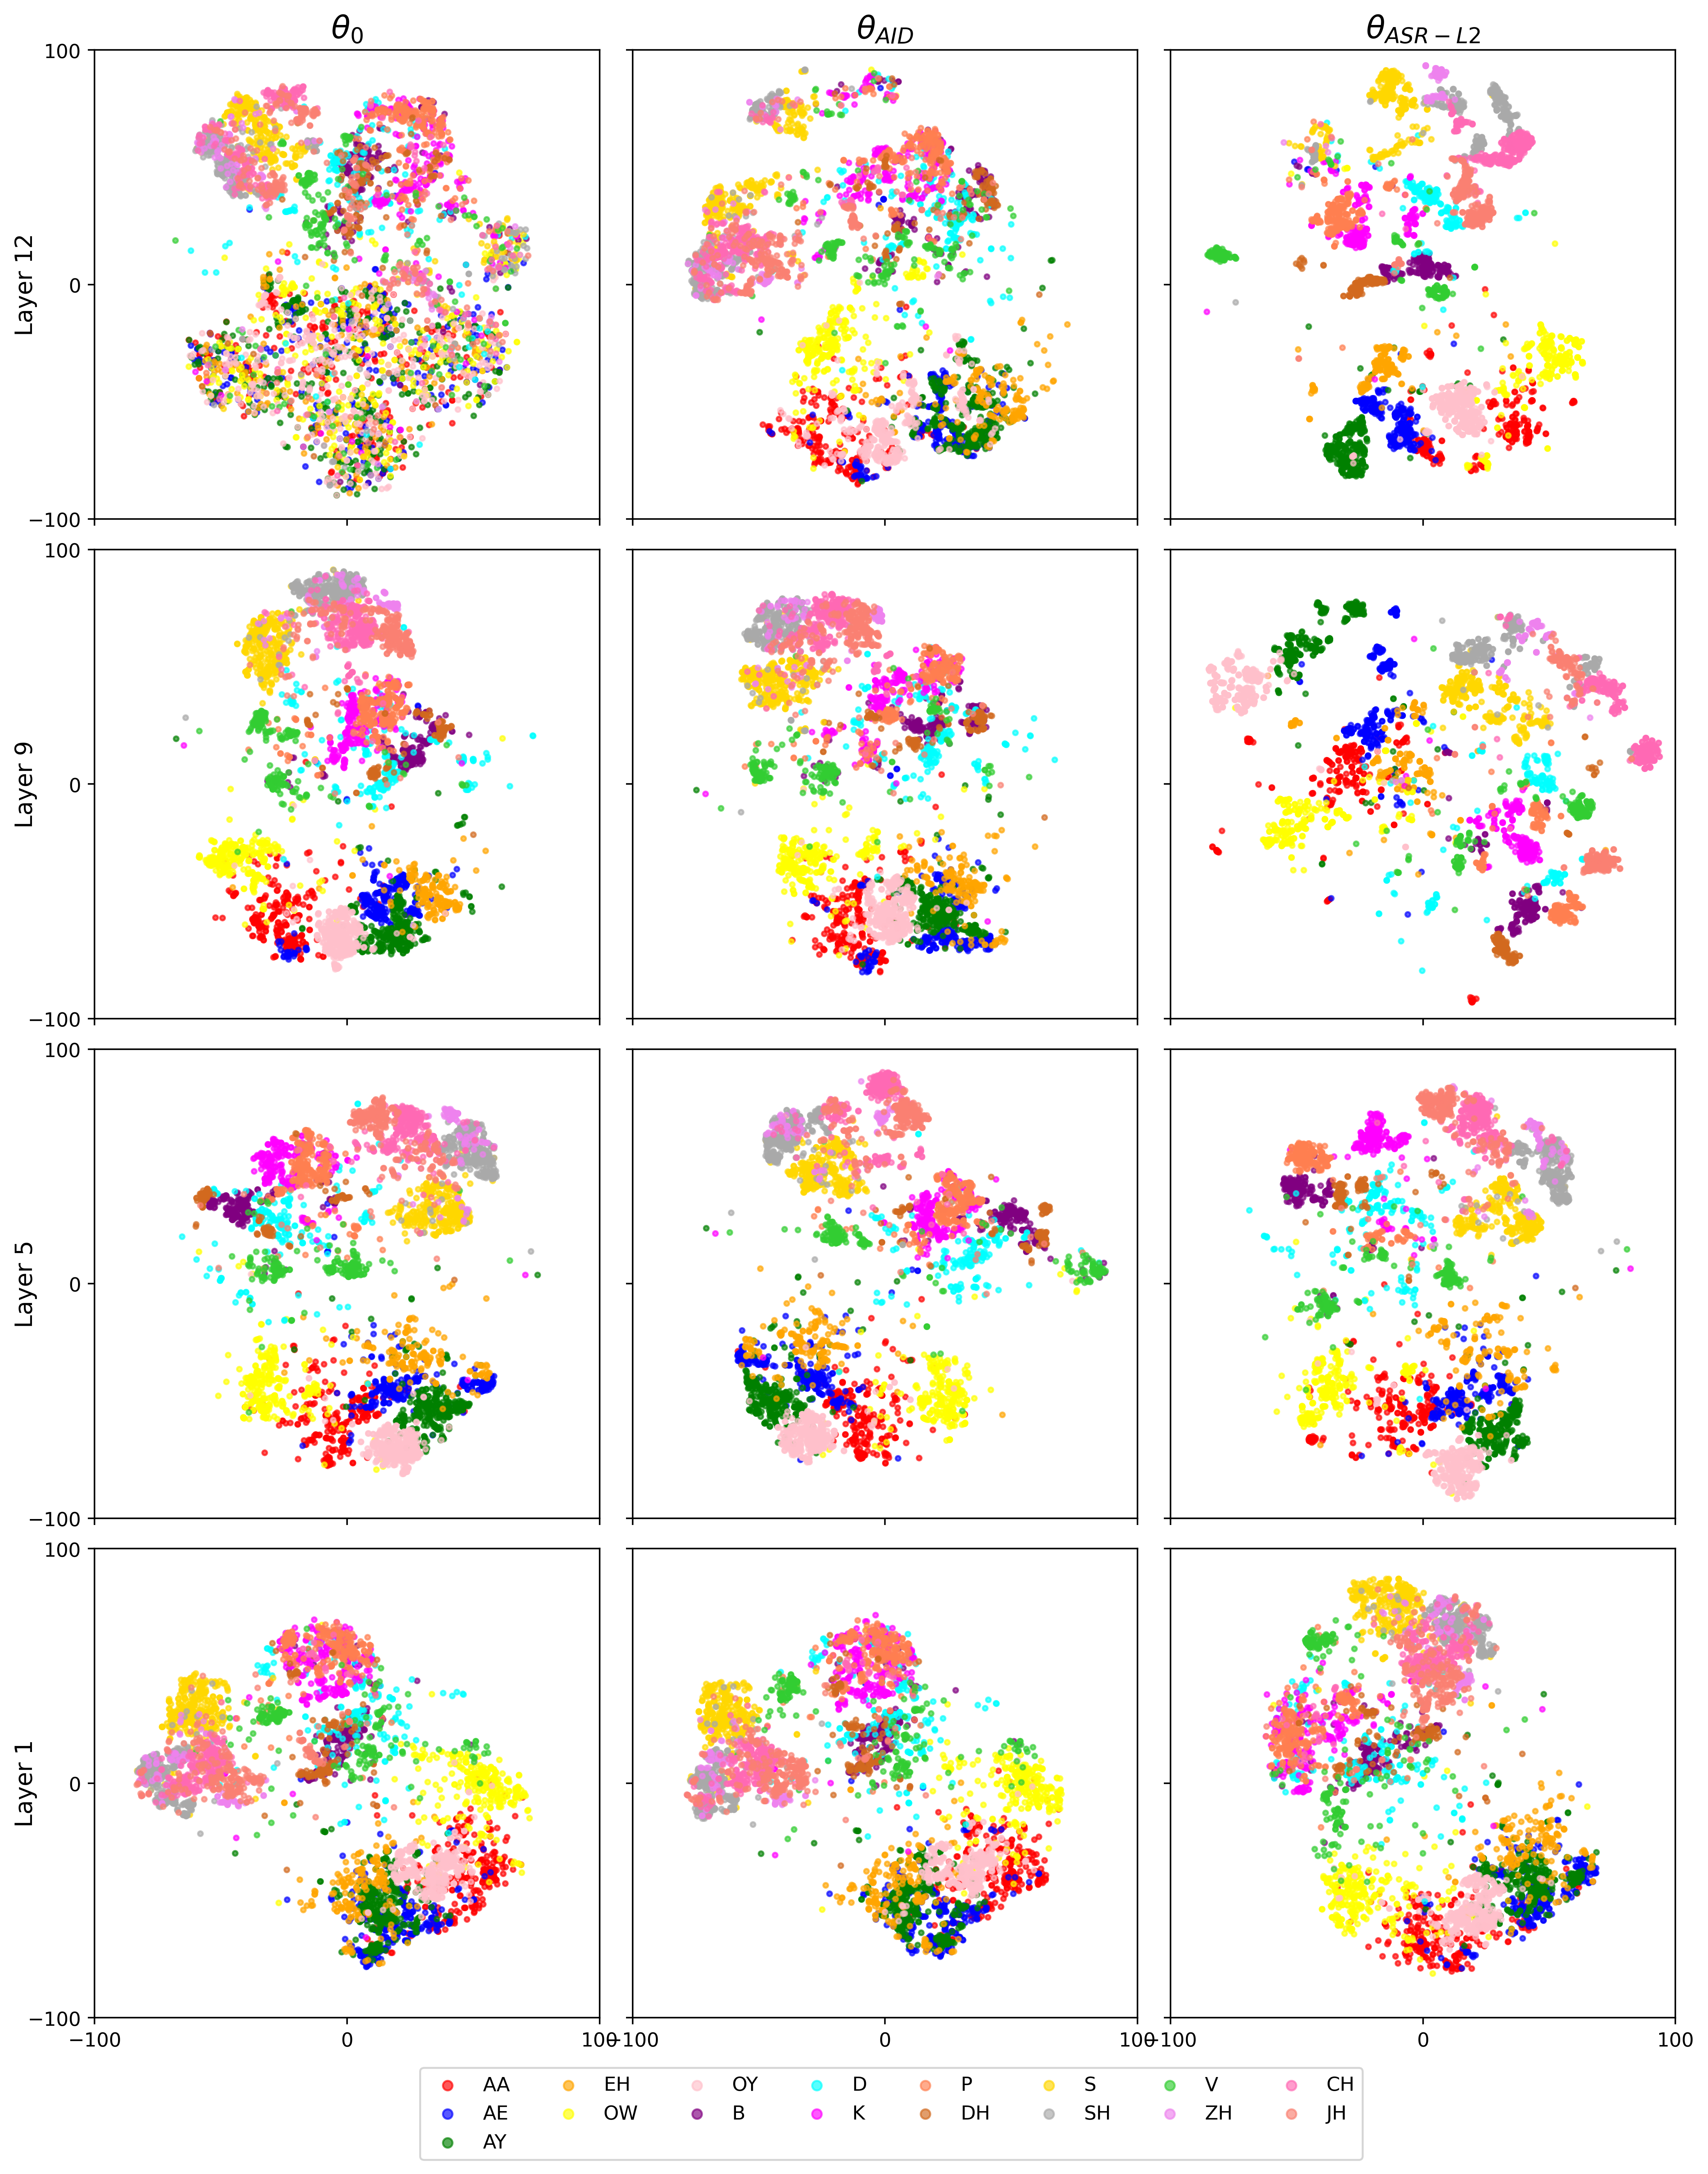
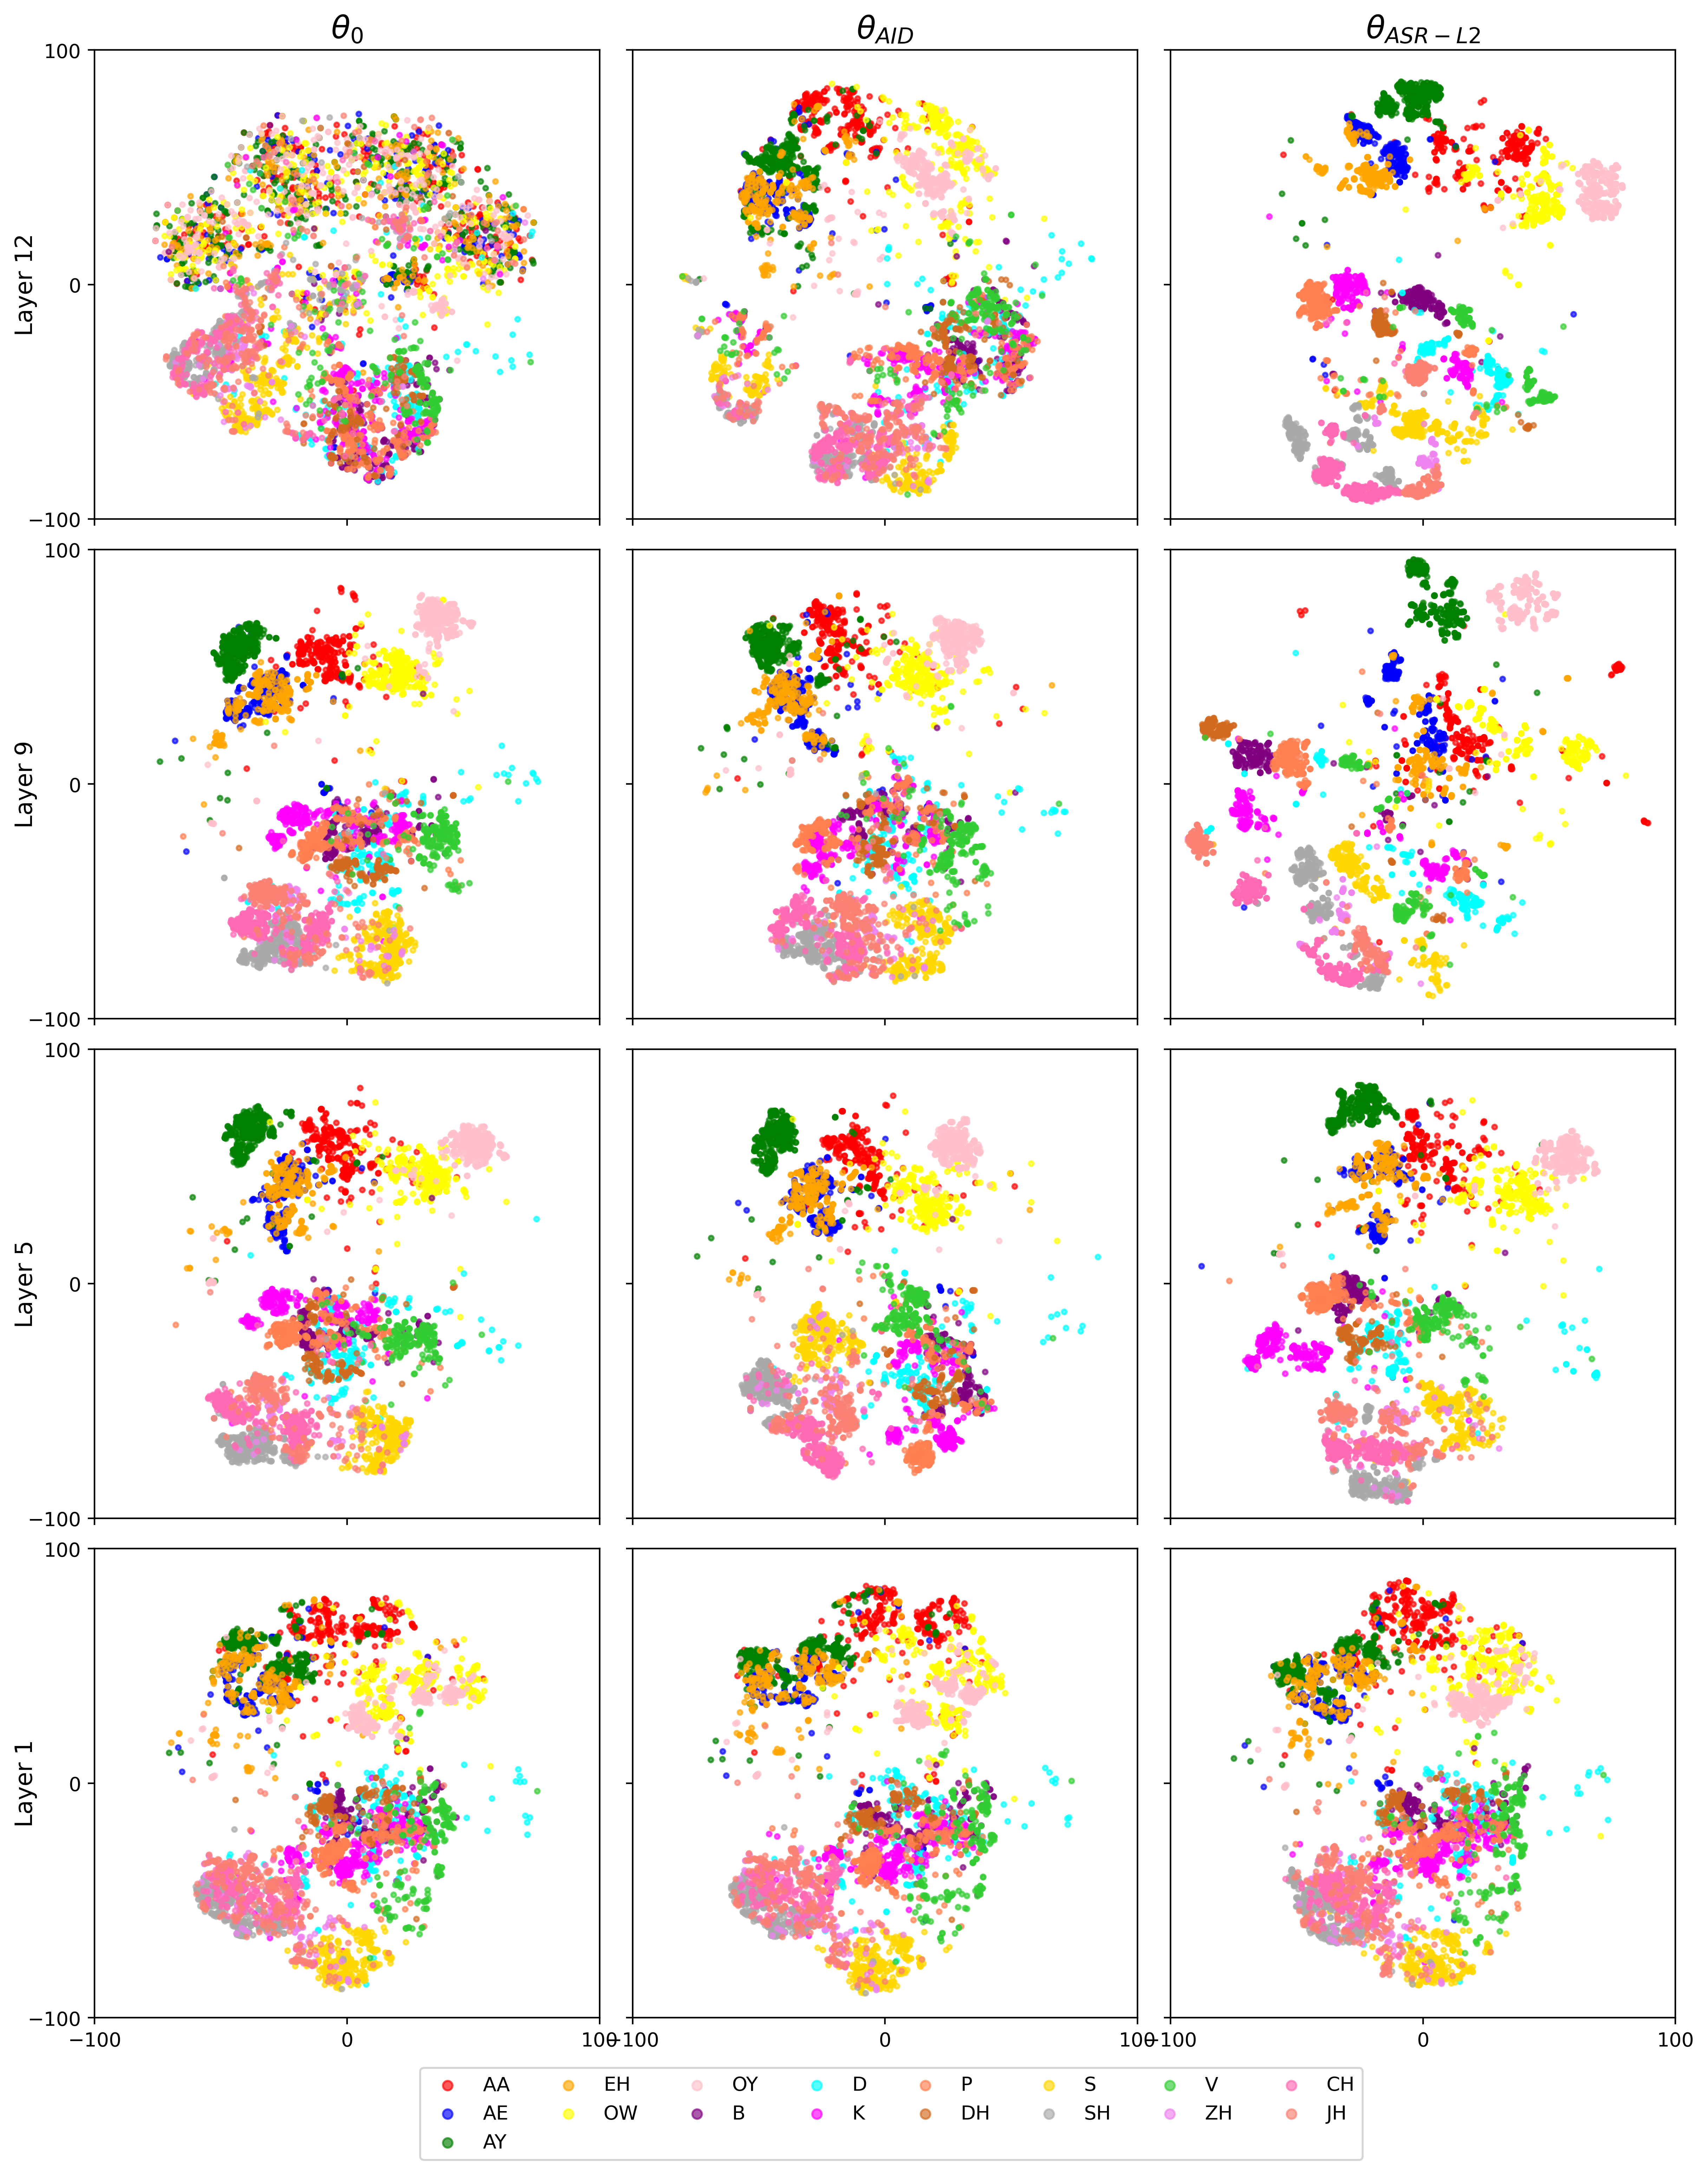
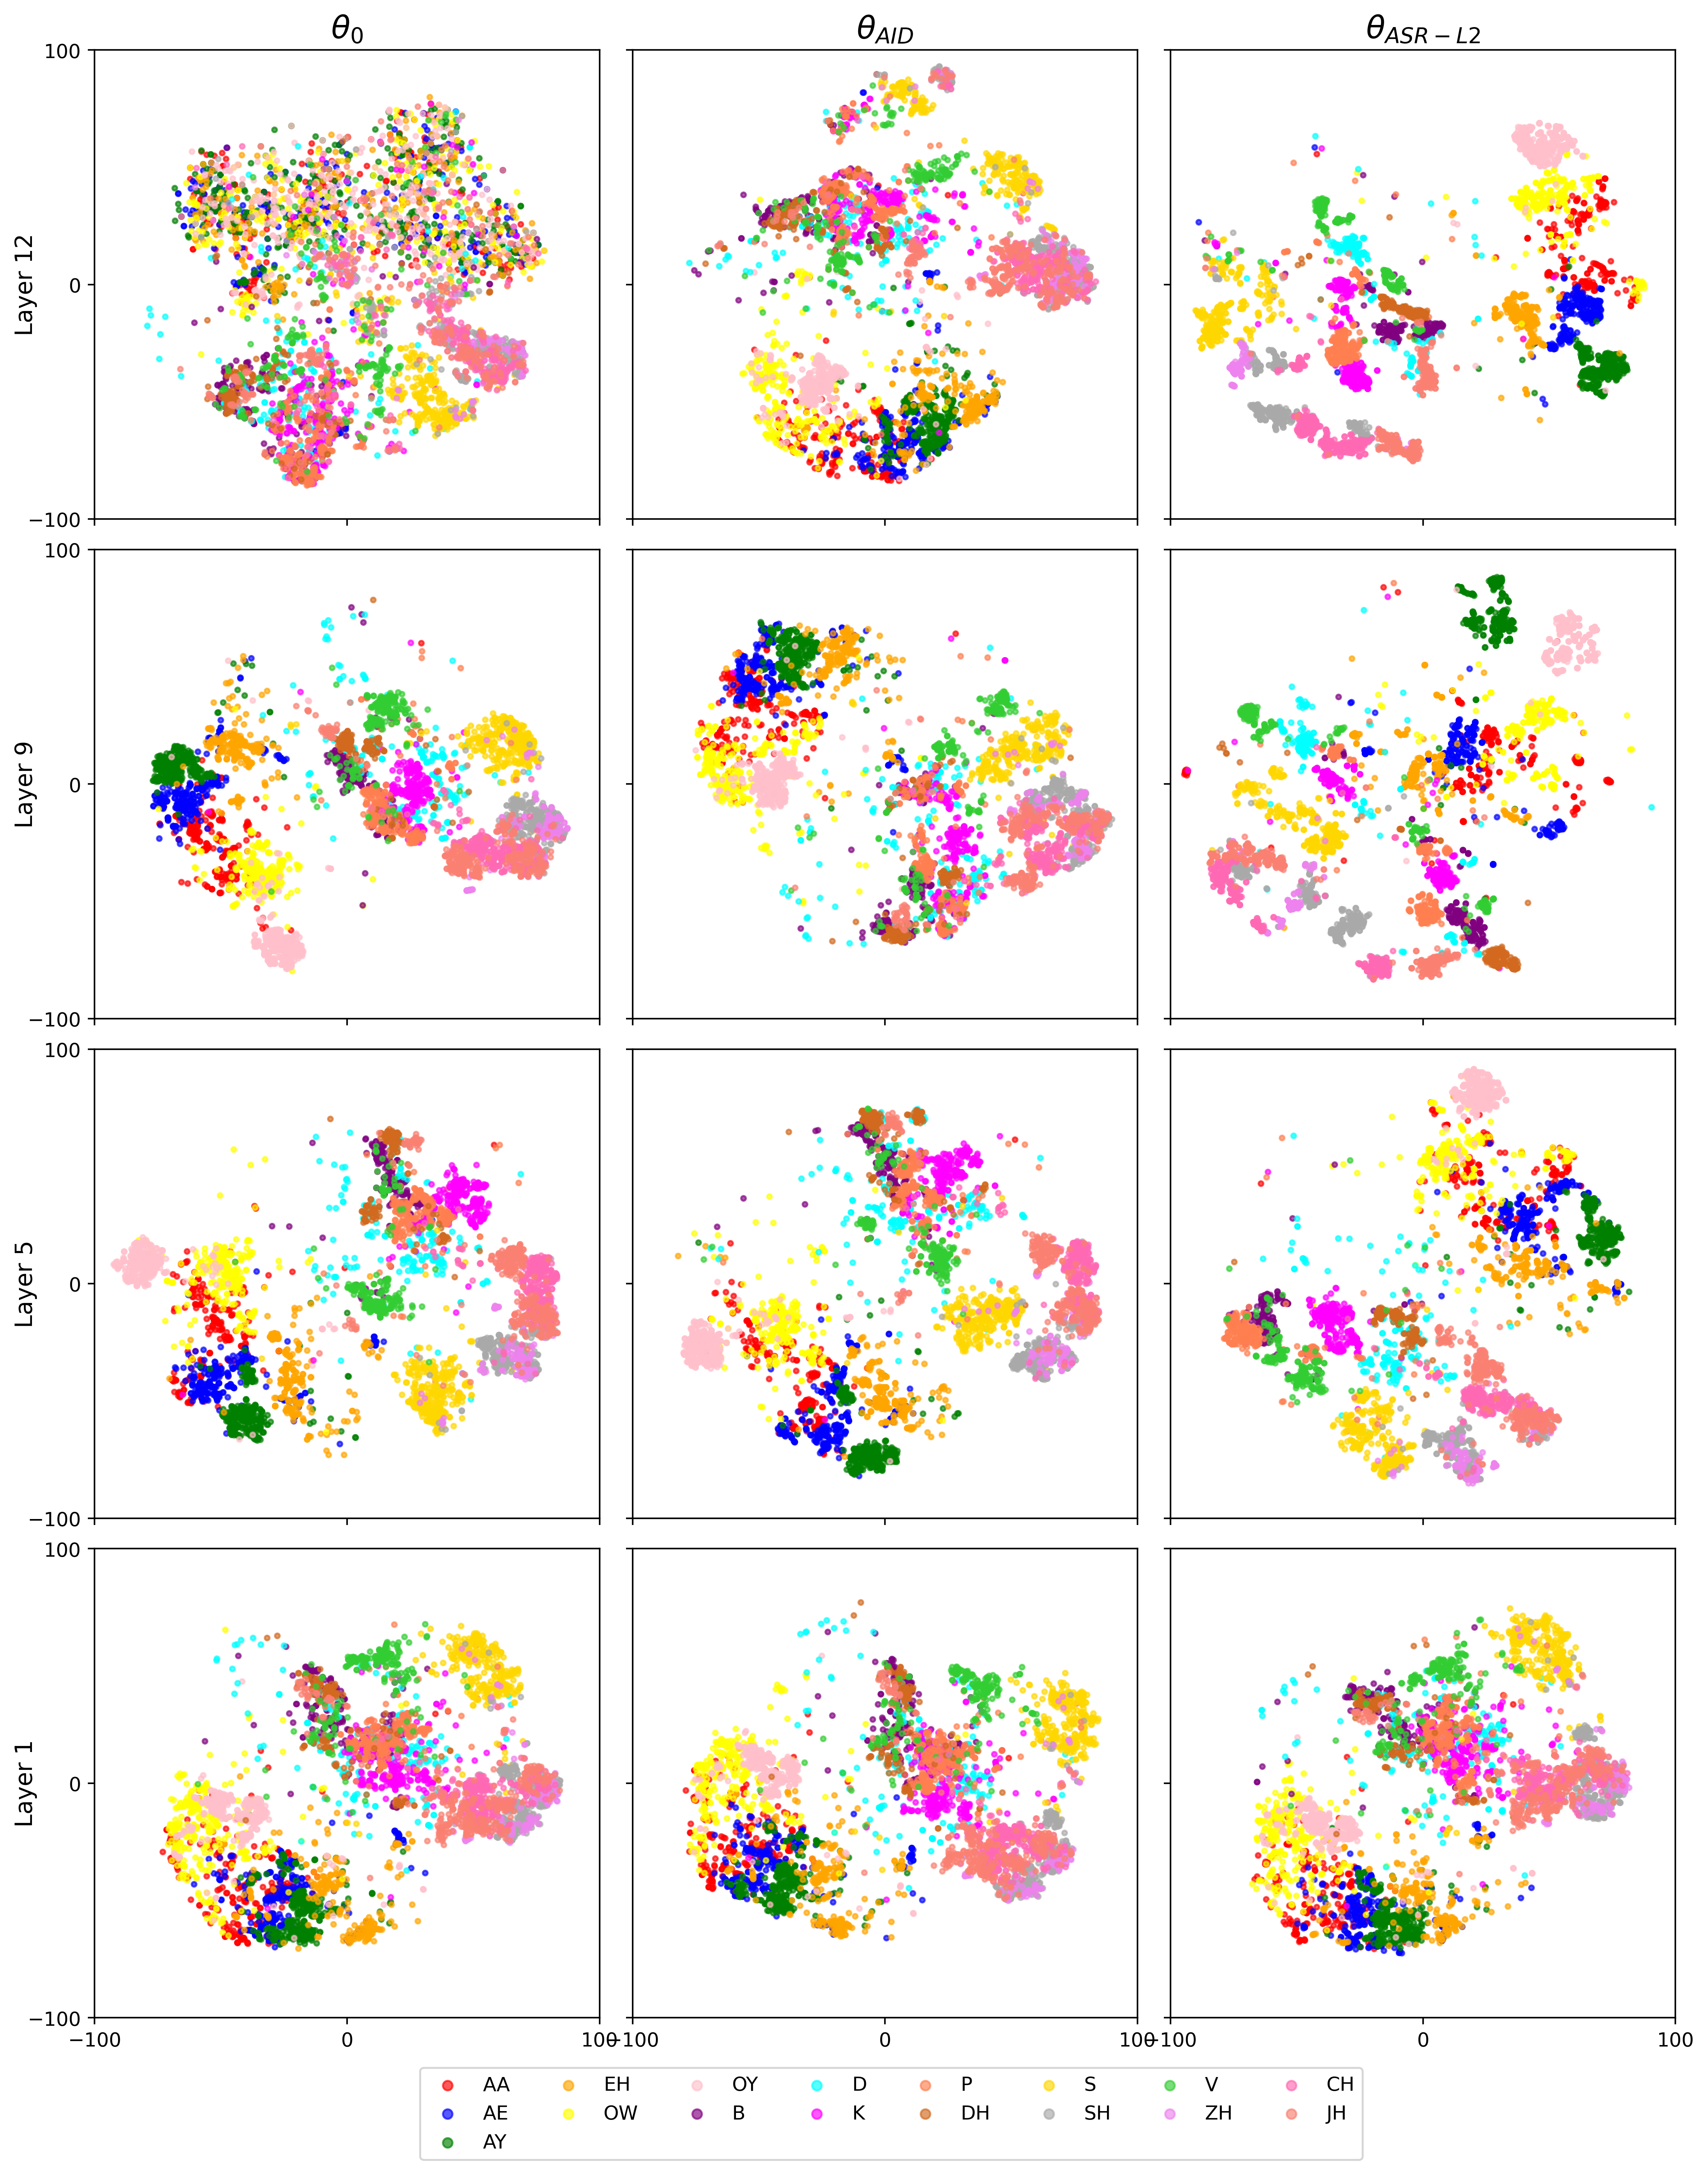
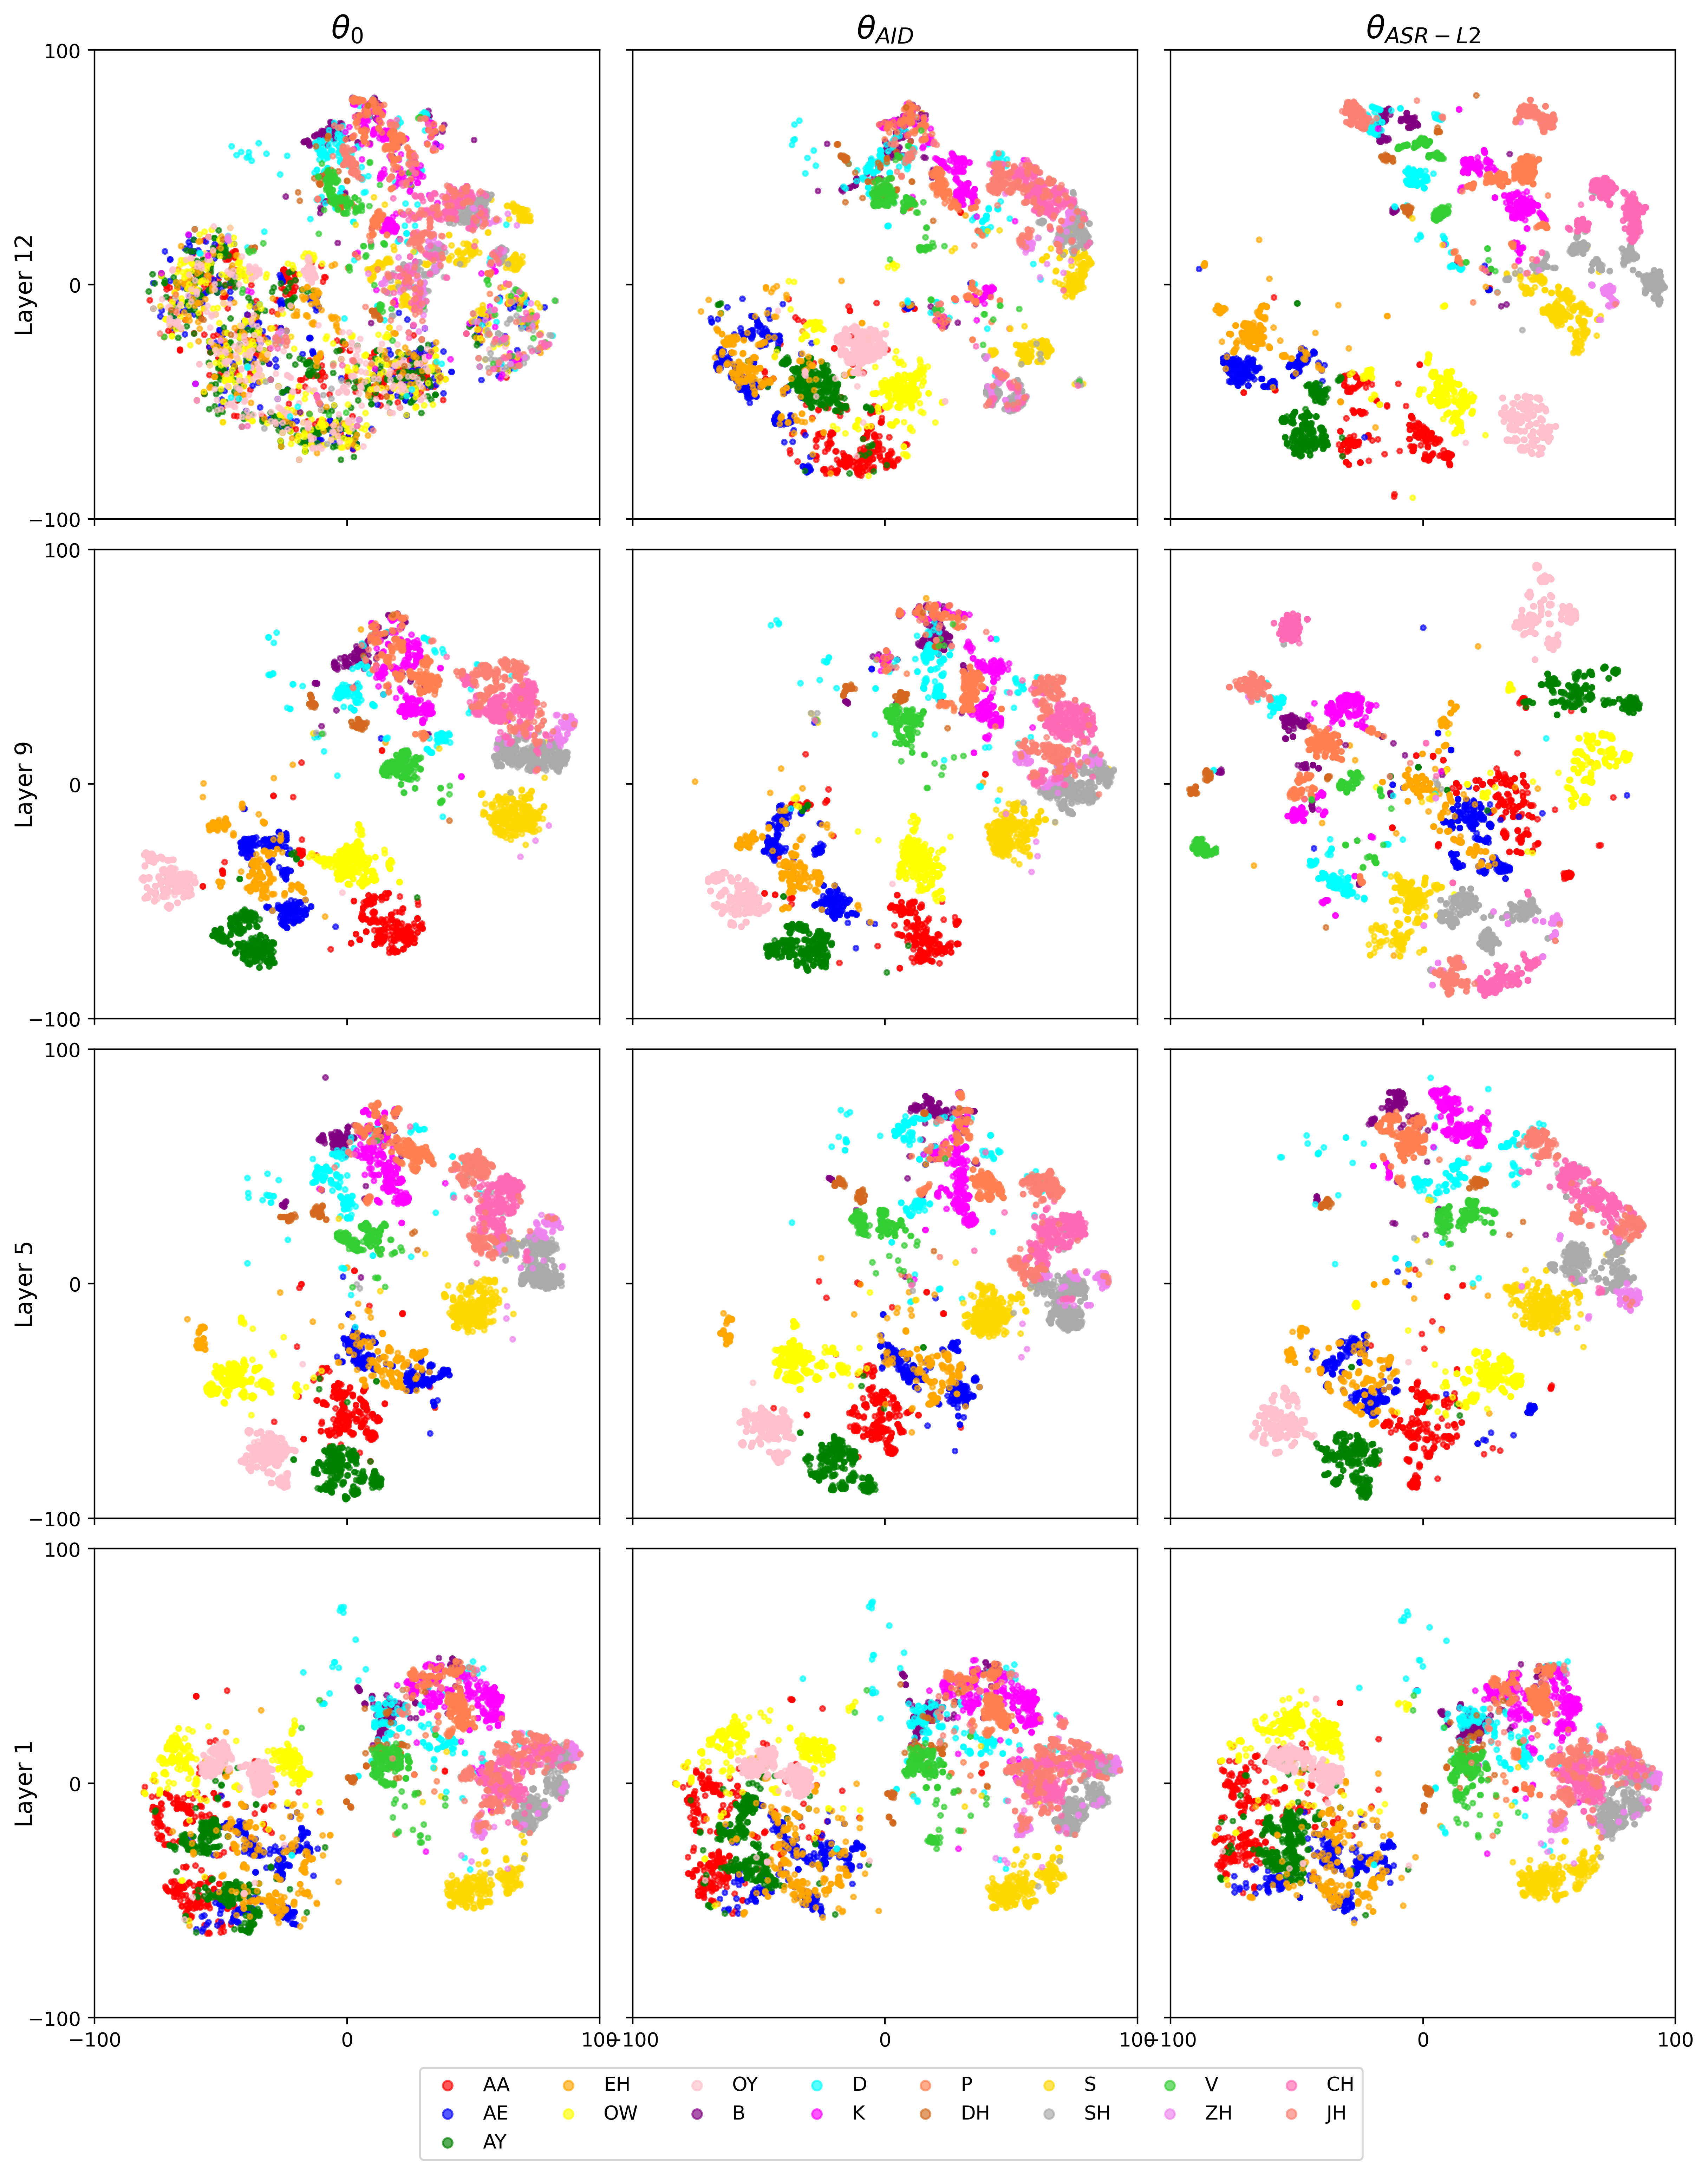
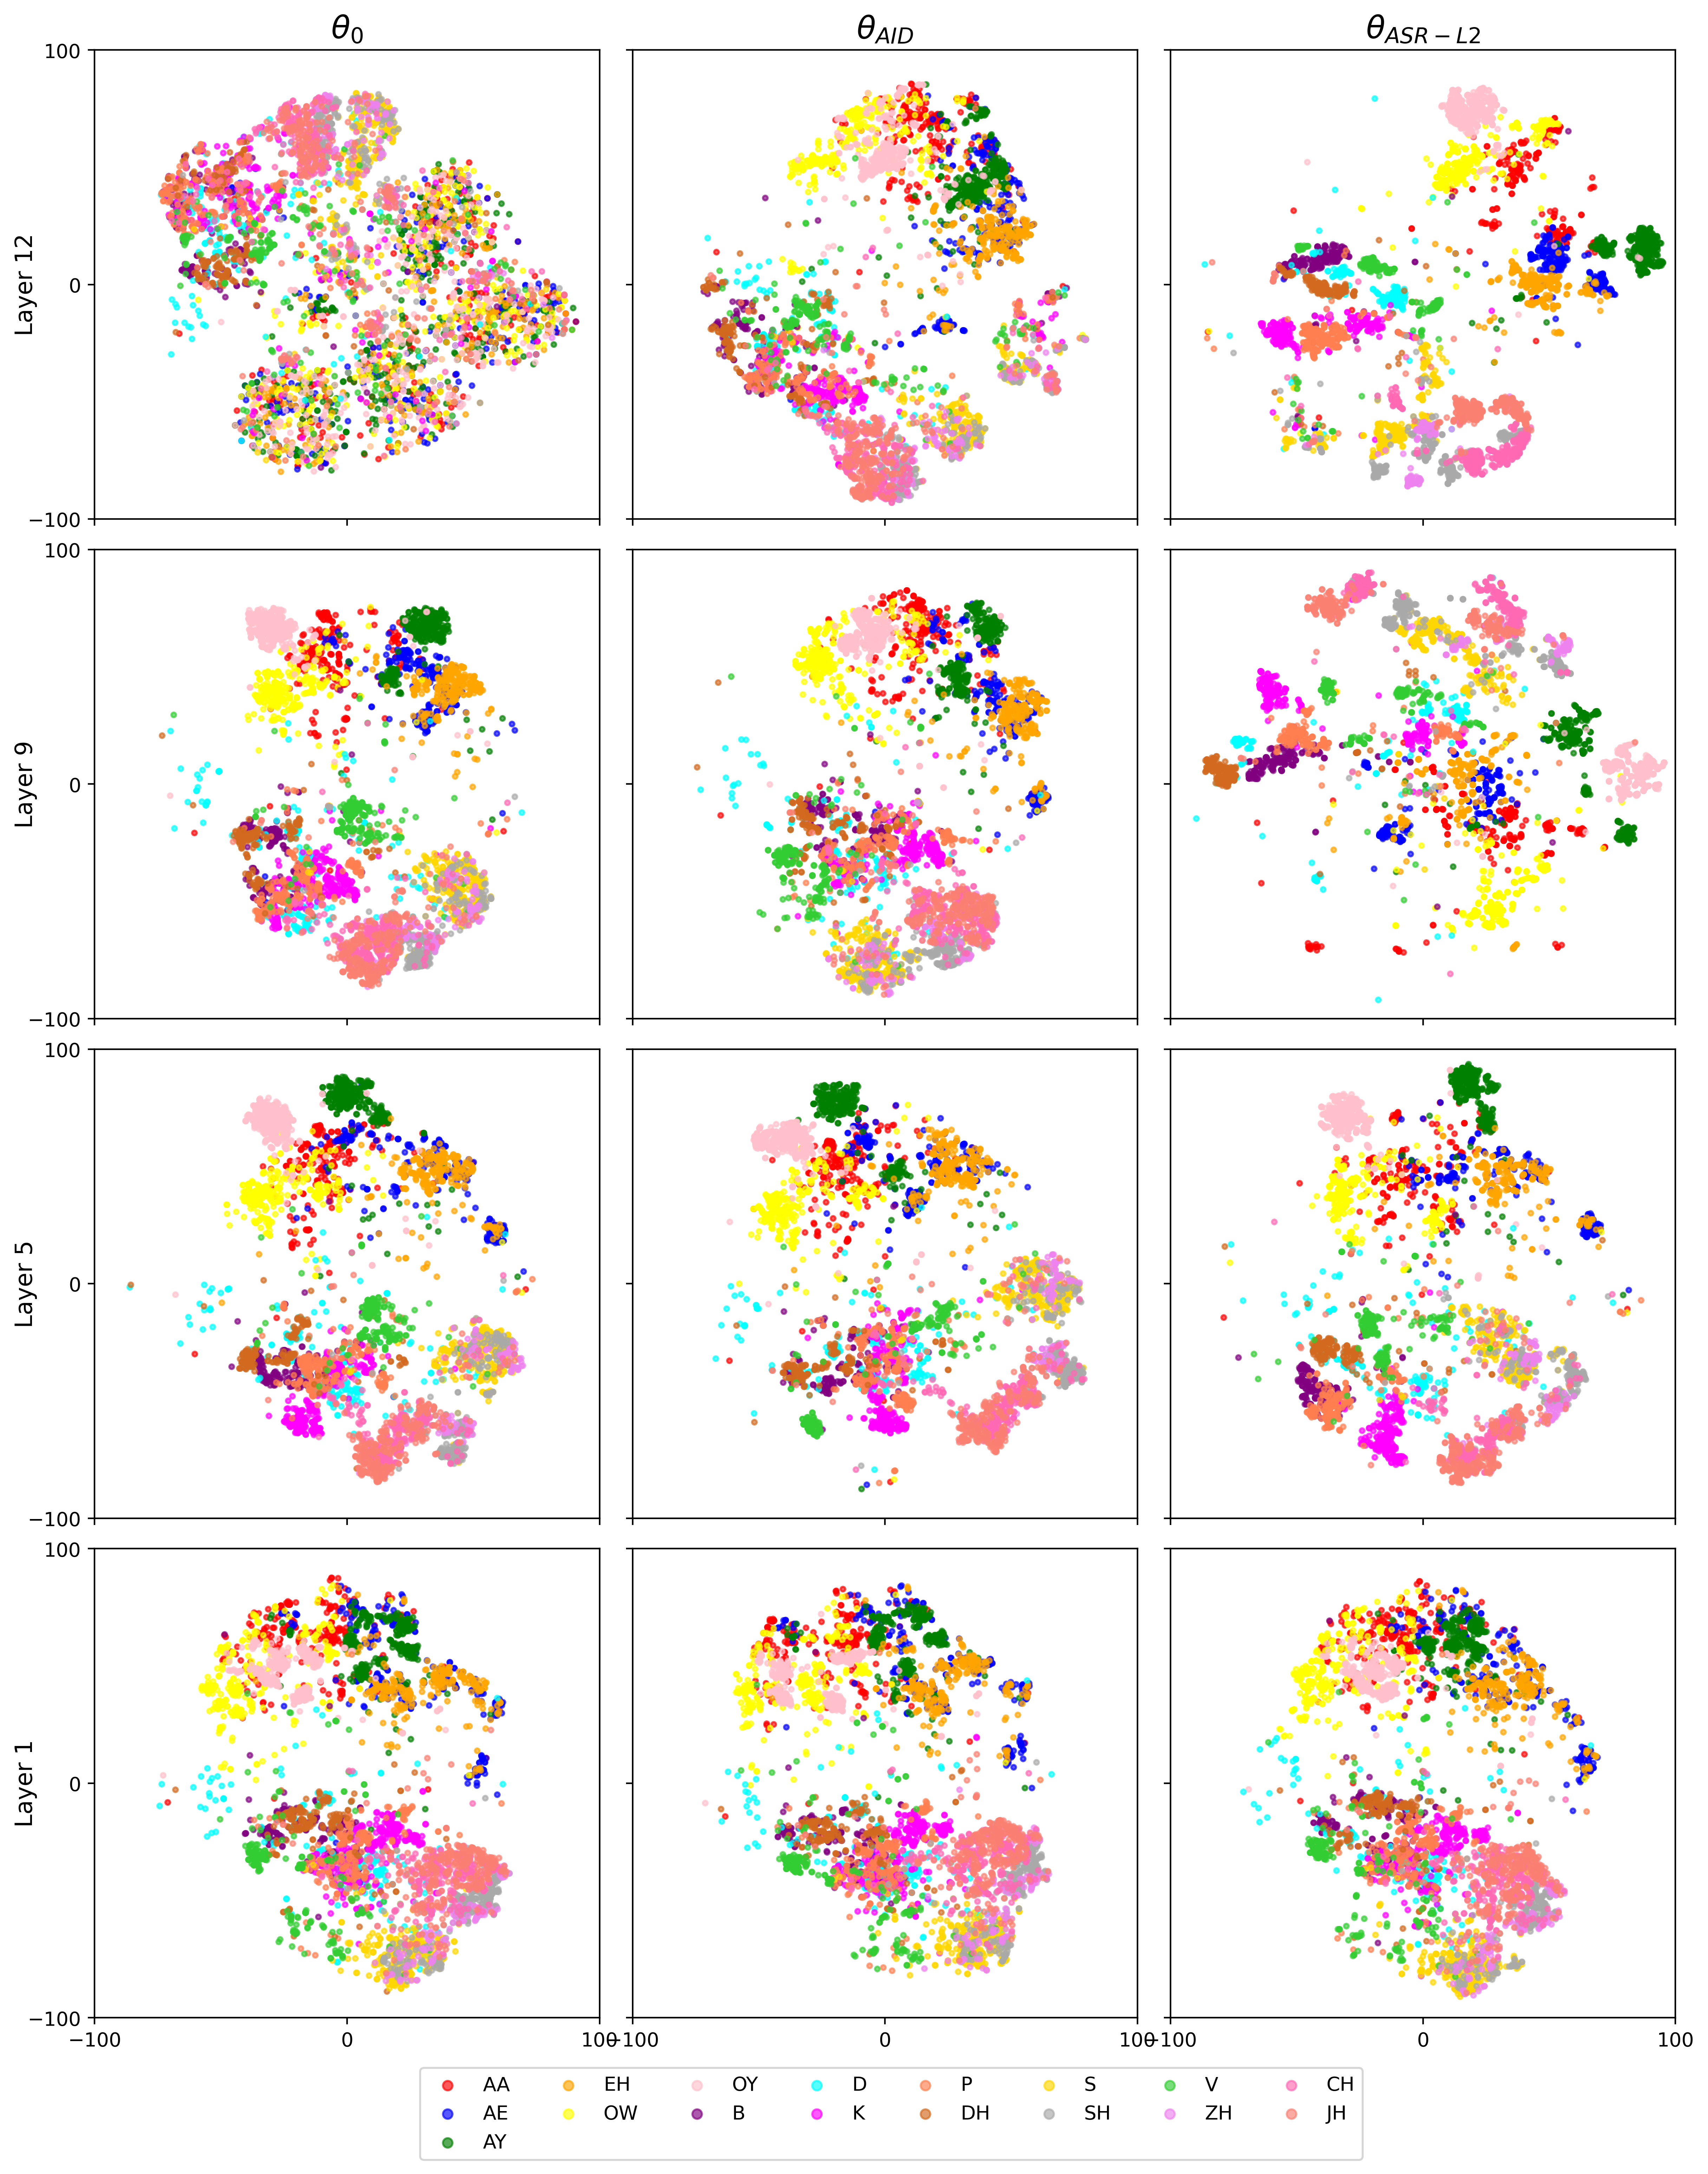
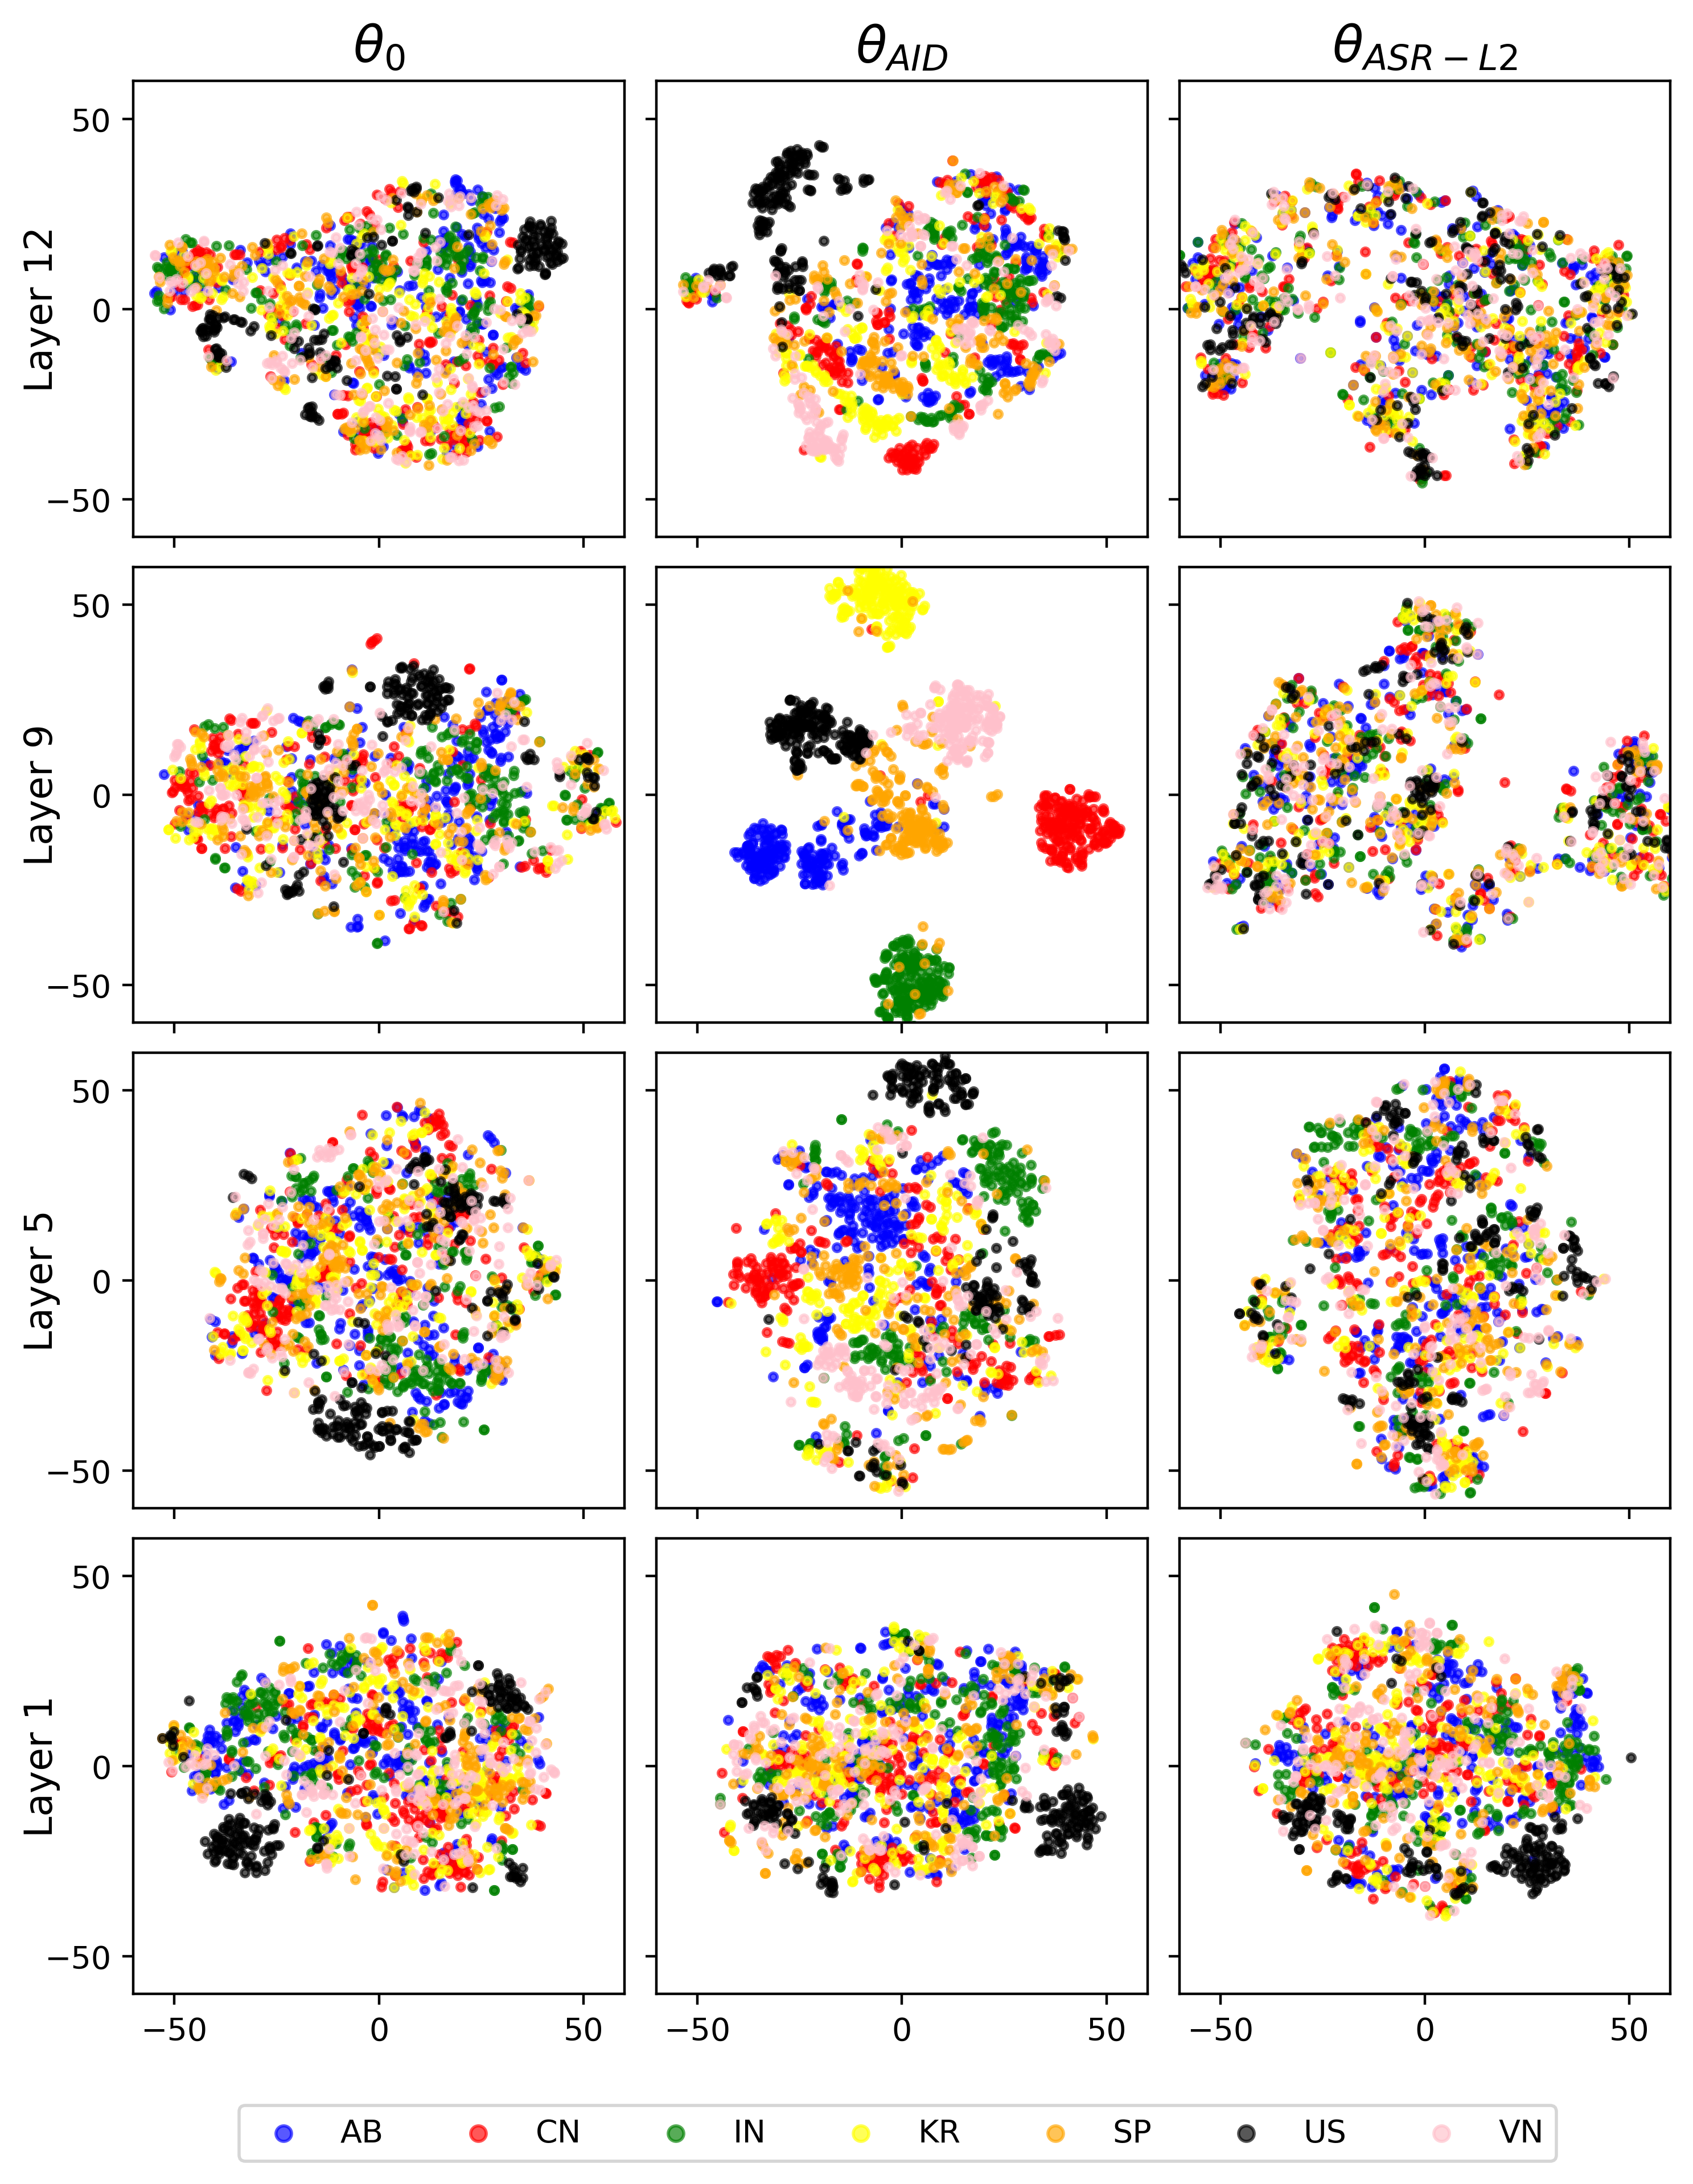
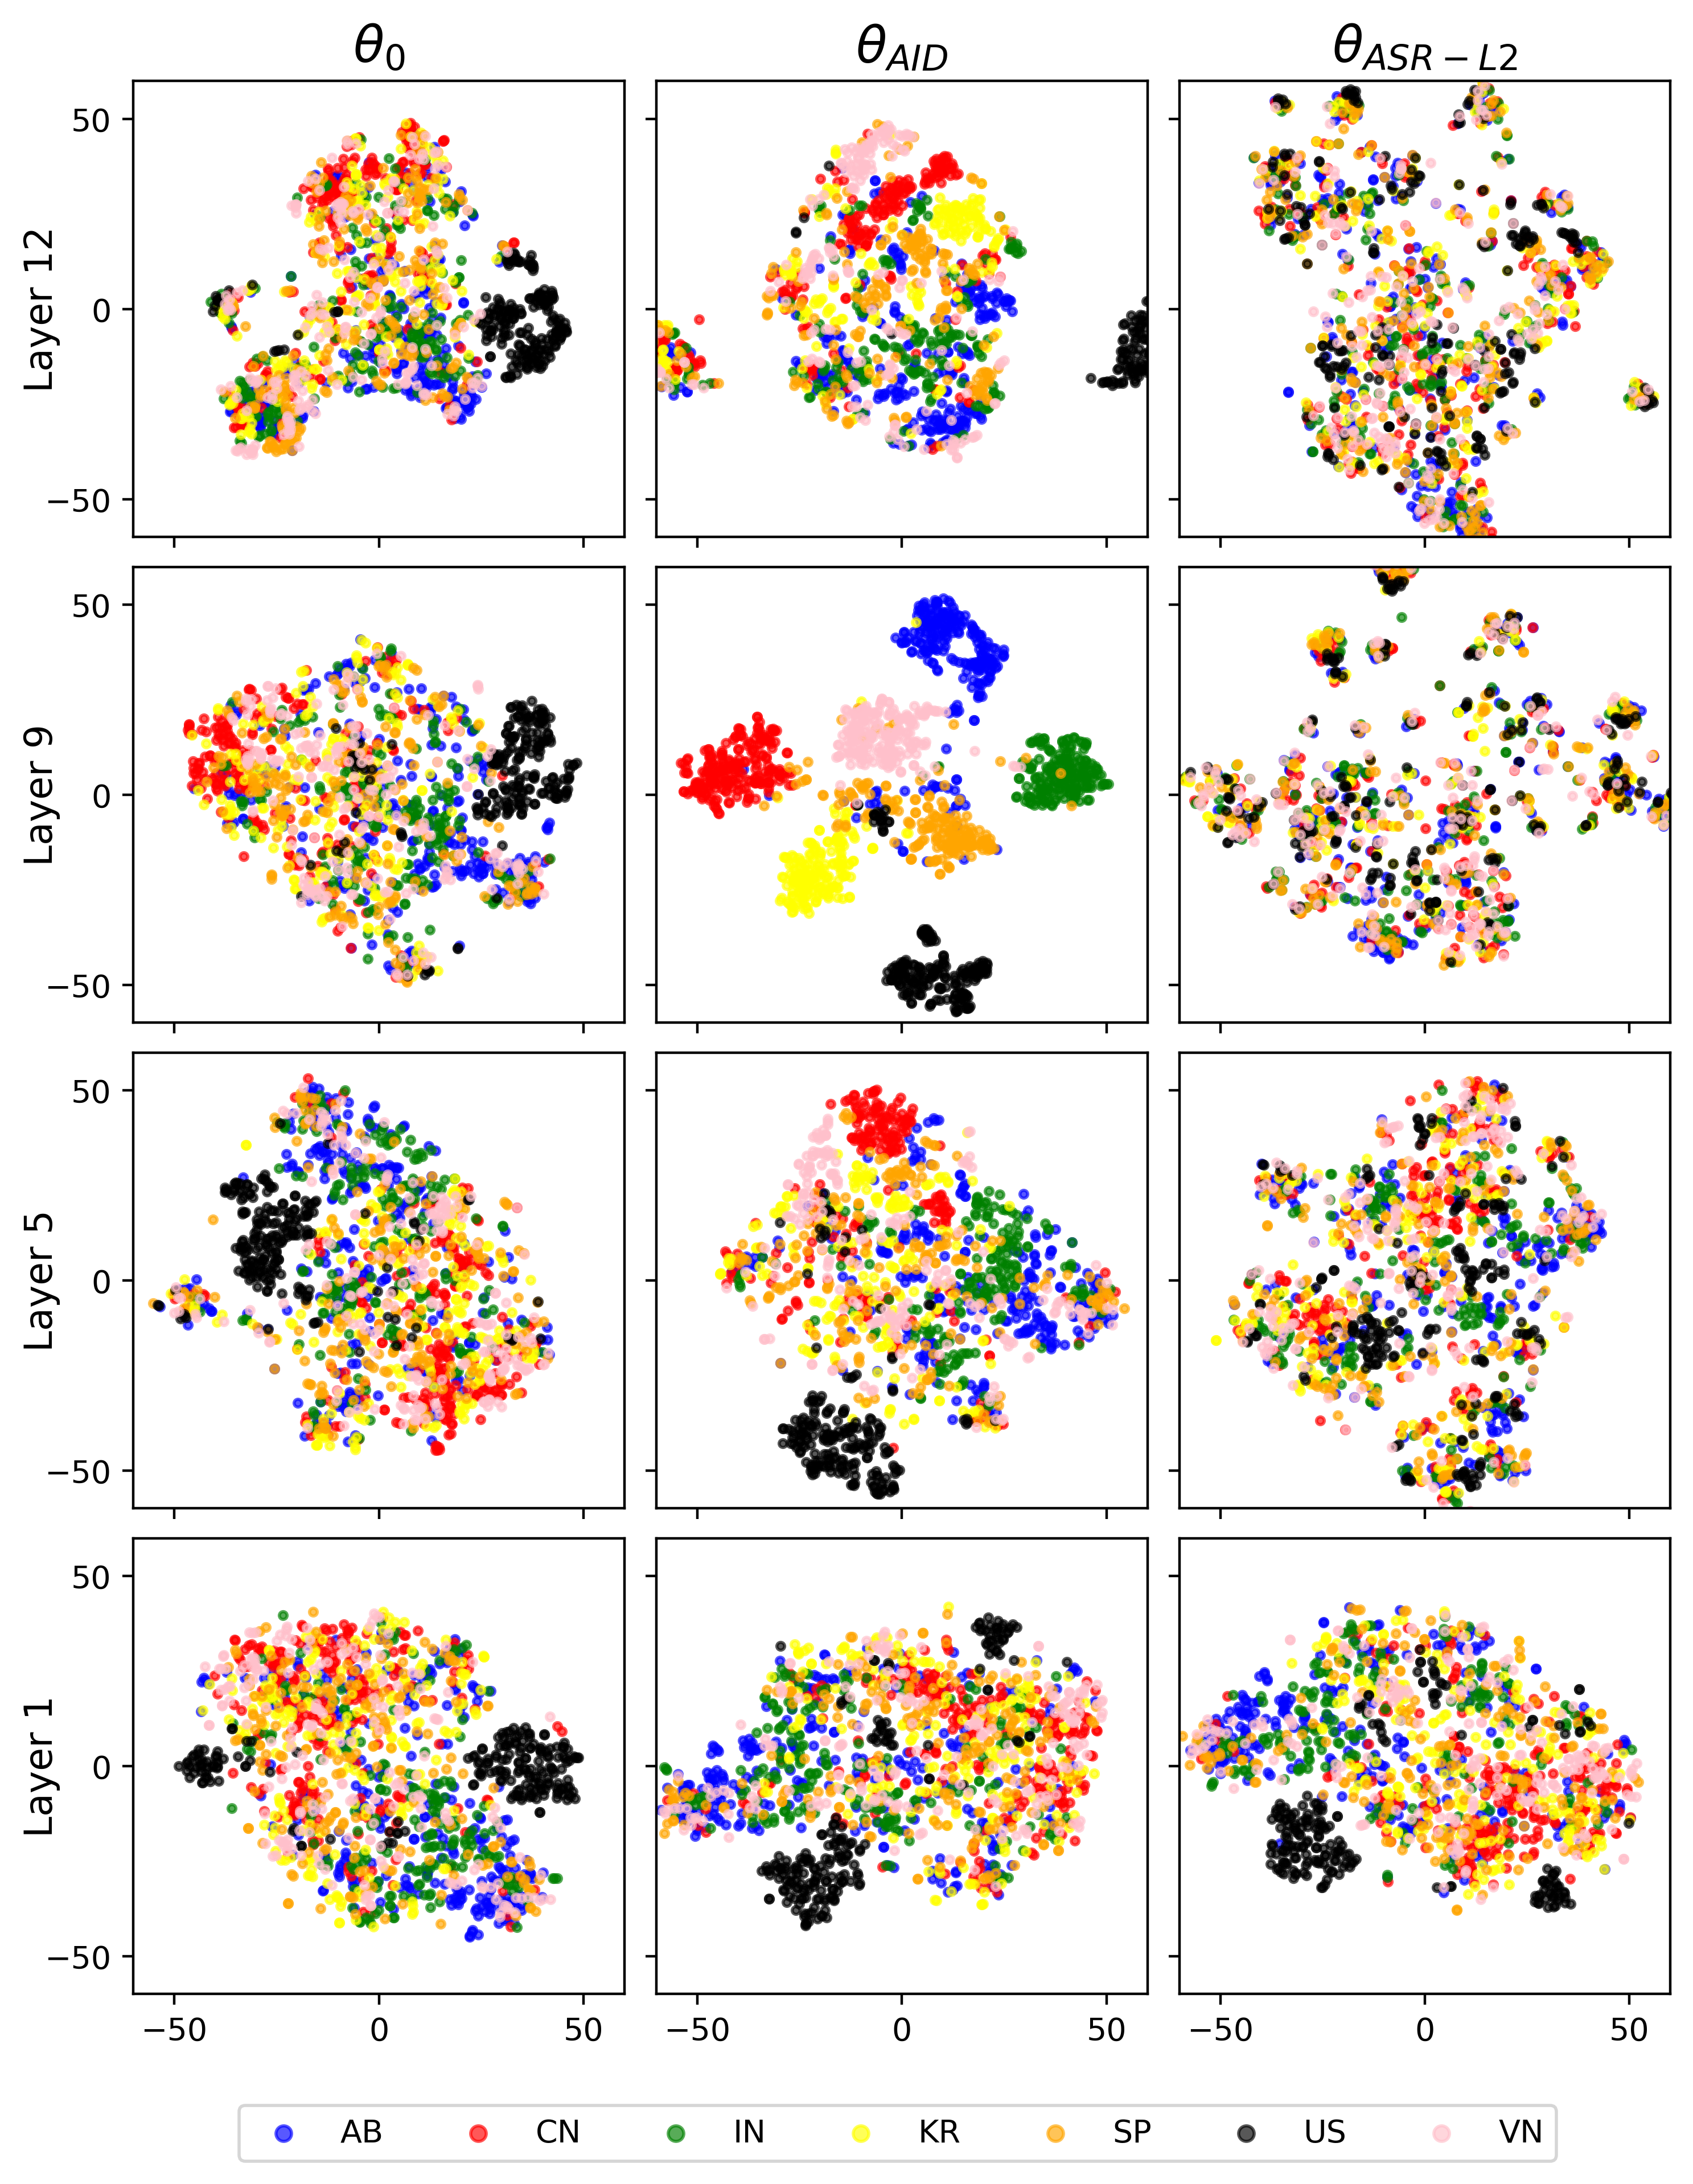
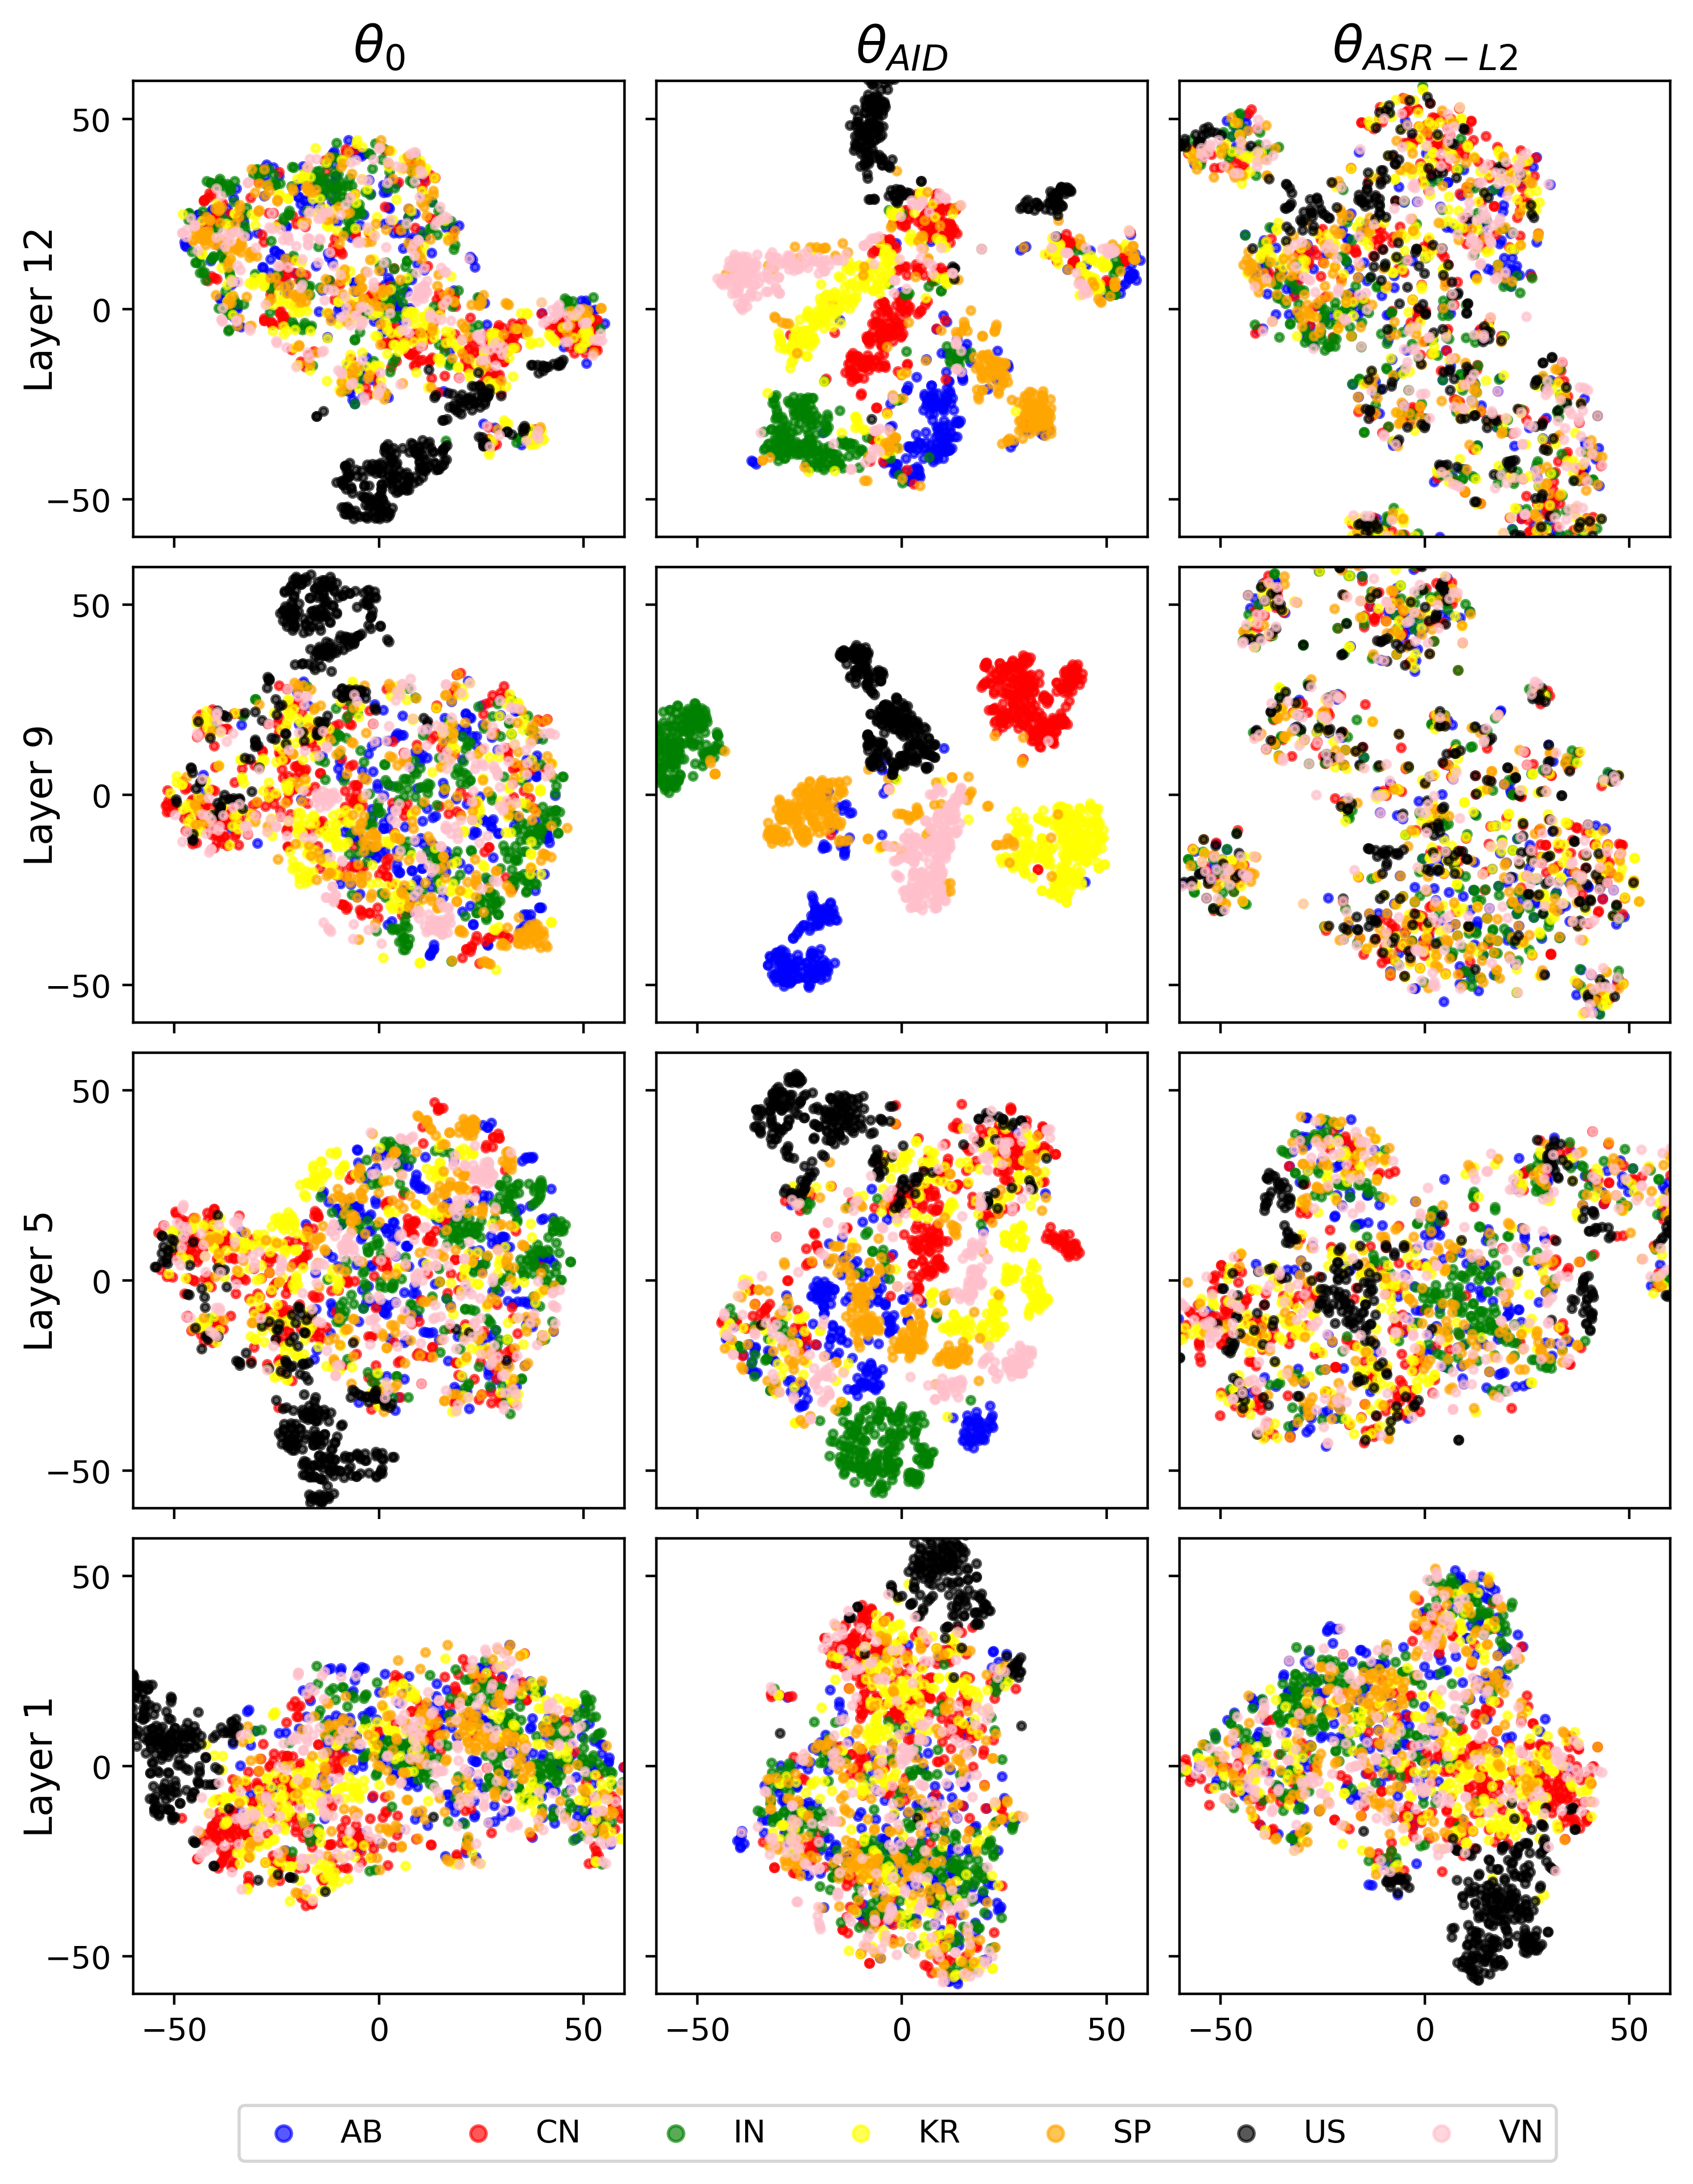
(Click on the buttons to toggle the figures)
Vowels
Stops
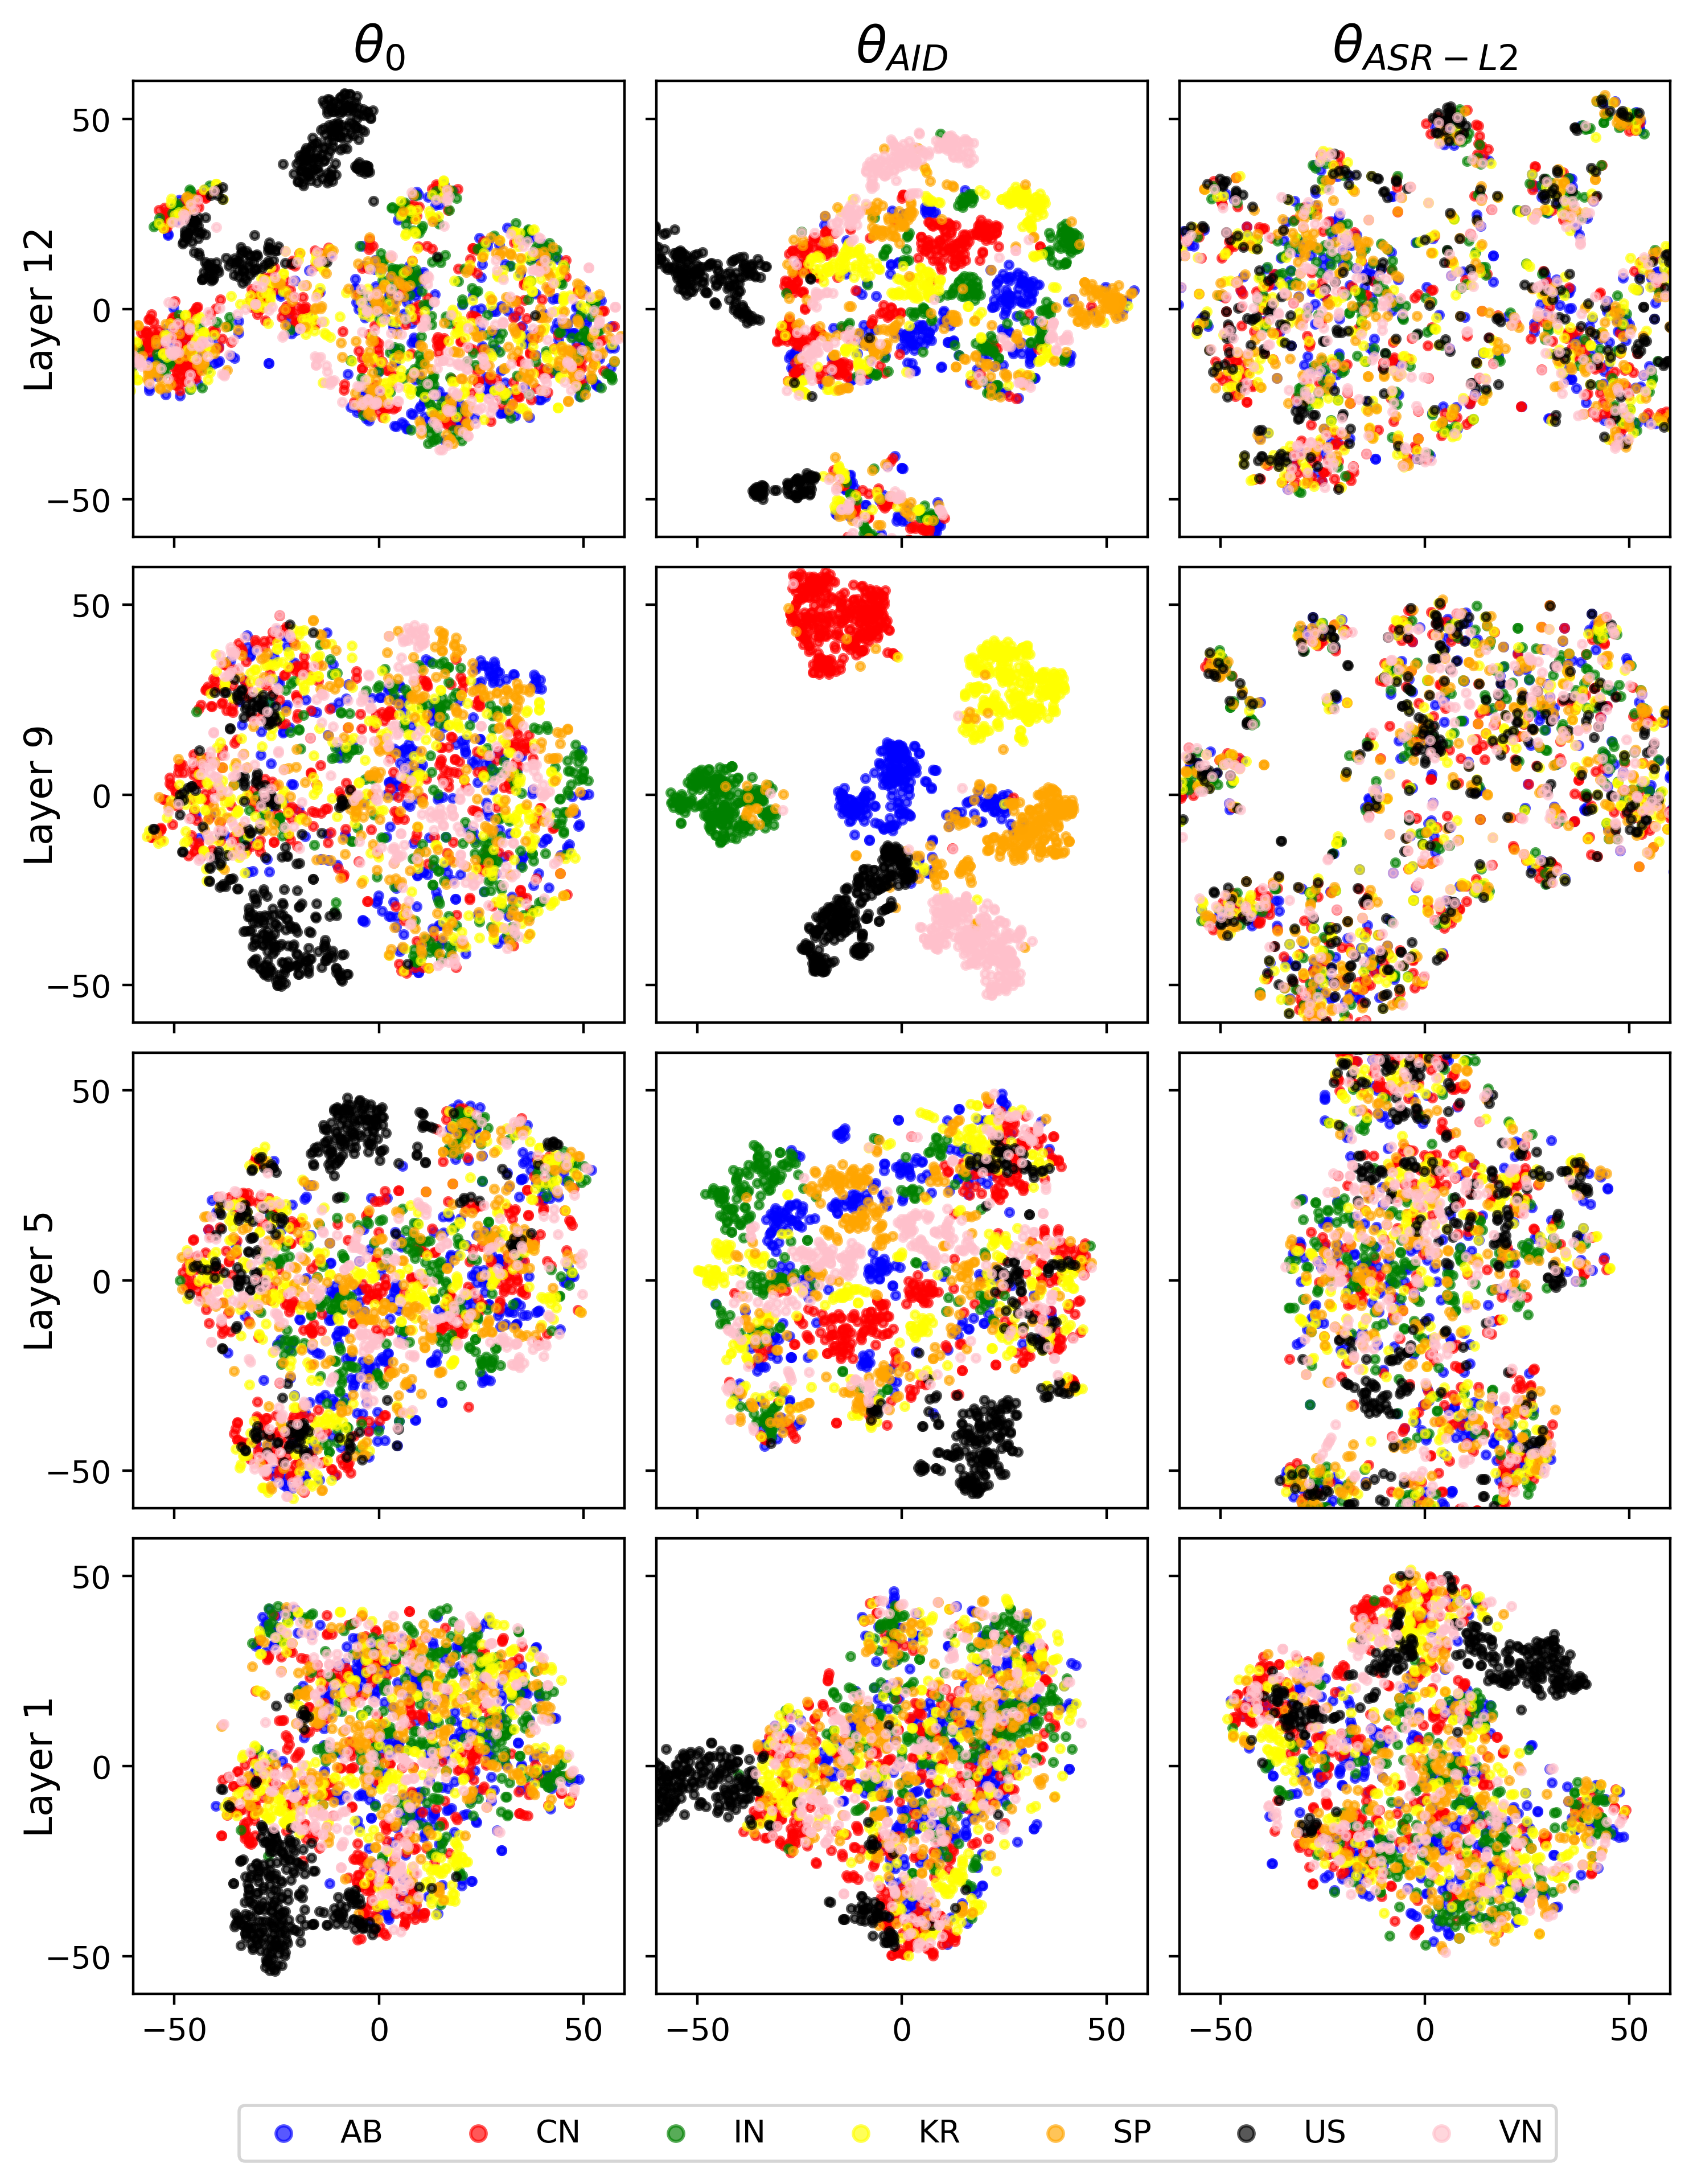
Fricatives
Affricates
Nasals
Liquids
Glides
Silence
(Click on the buttons to toggle the figures)